Musical Intervals and Lissajous curves
Investigating Lissajous curves
I set out to create a chord recognizer. At this point I have created a model that can predict a sound’s label by its spectrum. In order to create a chord recognizer from this, all I need is a language of chords for the labeling. How are chords labeled normally? What the heck does C major 7 mean?
What are Chords?
A chord is a set of notes played together, at the same time. Some notes sound good together. Other notes sound harsh together. And this harshness is related to the musical intervals present. Much of the chord name has to do with the intervals that are present in the chord. Chord names also contain the name of one note that the chord is anchored to. So chord names contain a reference to a specific note and references to other notes by way of intervals. The C major chord has the notes: C, E, and G. The name only makes reference to the note C. The modifier major refers to the presence of a note with a major third above C (E) and a perfect fifth above C (G). A chord with the same quality, major, can be constructed relative to any note.
What Intervals Sound Like
Interval refers to the distance between notes. The concept of an interval should be thought of as a proportion. How many of one wave fits into how many of another wave? So when we see the proportion 3:2, think of a space containing both 3 lobes of a wave and 2 lobes of a wave. The sound of an pitch interval 3:2 is called a perfect fifth in music theory prevalent here. The sound of a perfect fifth is the first two notes of Star Wars Theme.
What Intervals Look Like
One way to visualize the interval is with a time series graph. Here the lines represent sound pressure over time for two notes a perfect fifth apart.
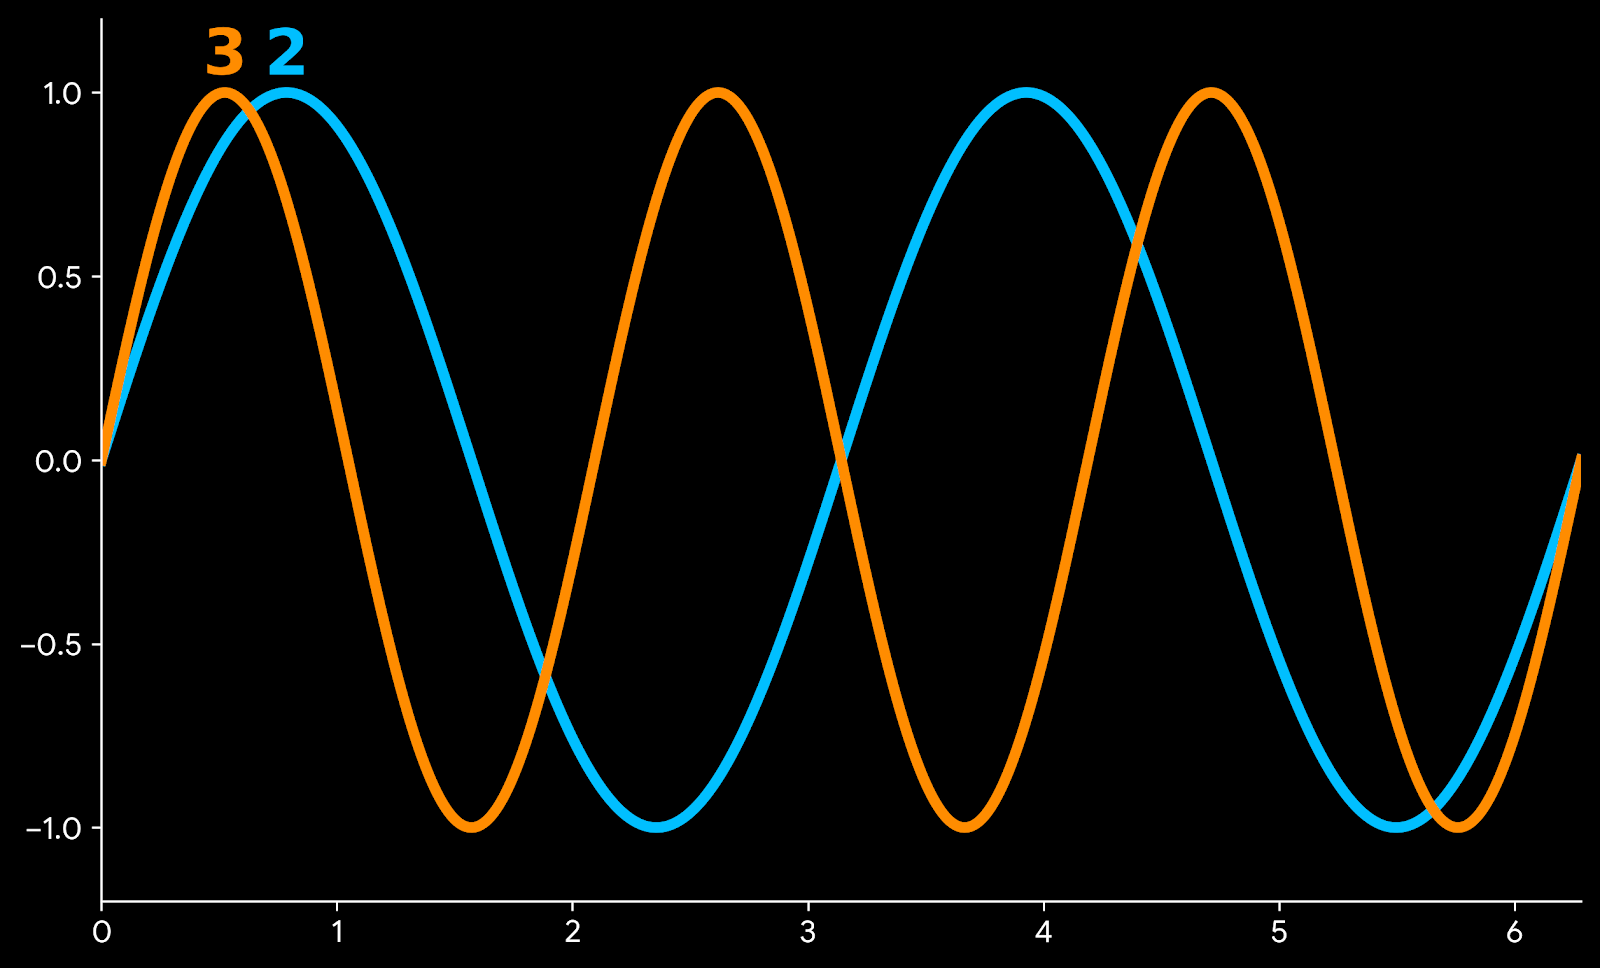
Perfect Fifth Interval (3:2)
This pair of curves shows how in the time it takes the blue wave to pulse twice, the orange wave pulses three times. This pattern is repeated exactly as time progresses. Another type of graph shows how the pressures vary together.

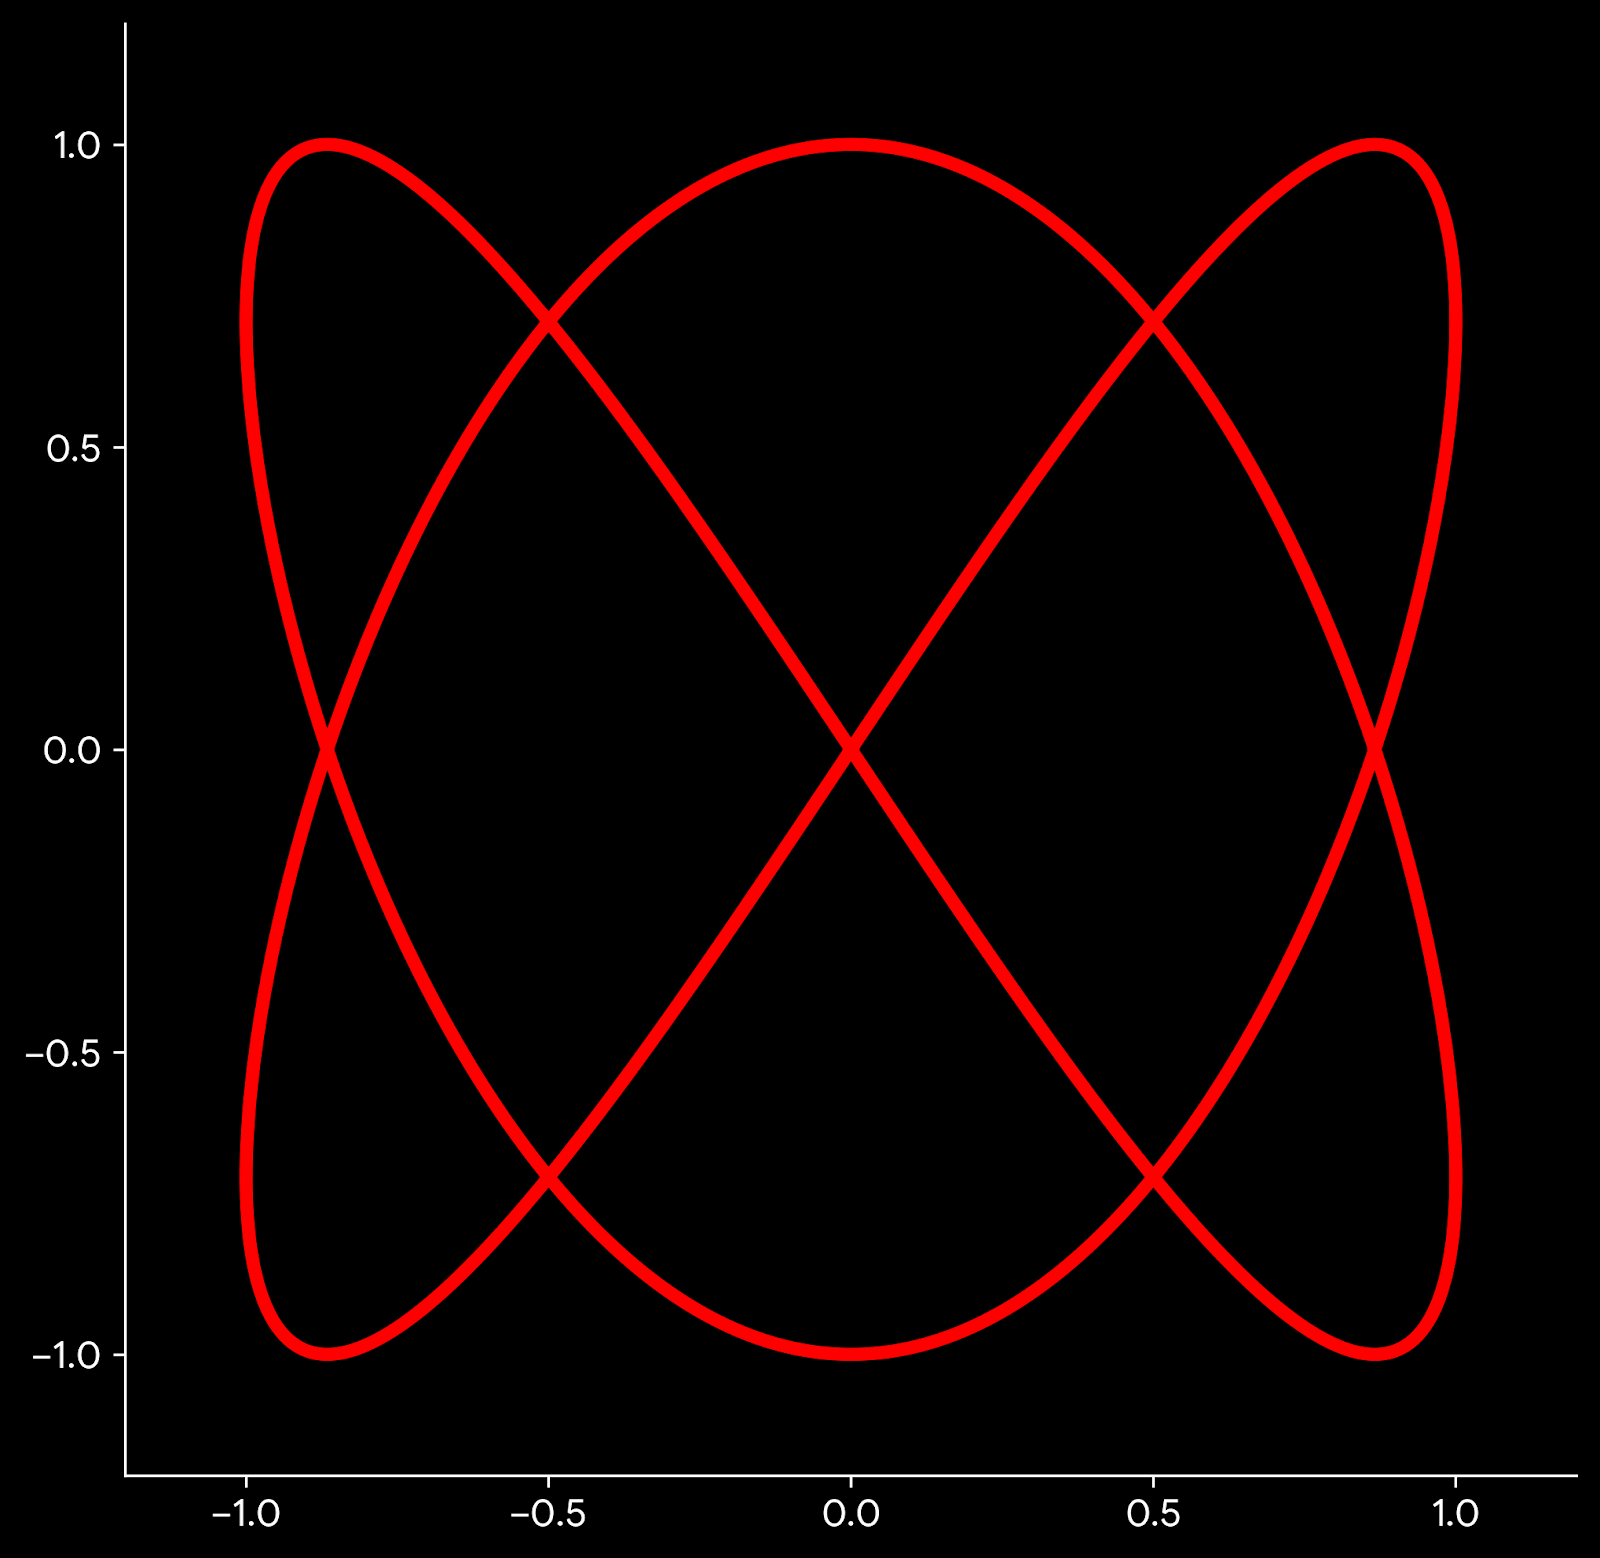
Lissajous curve for a Perfect Fifth
This graph is made using the same two waves. But here the line is created using the blue wave for X coordinate and the orange wave for the Y coordinate. This parametric curve is known as a Lissajous curve. The Lissajous curve depends on interval (frequency ratio), not on frequency itself. You can multiply frequencies by any constant and obtain the same Lissajous curve. The Lissajous curve is sensitive to phase. Try adding a phase angle to one of the component and see how the curve changes.
Questions
So what does a Lissajous curve tell you about a musical interval? And why does varying the phase angle appear to be the rotation of a 3D curve? Could the Lissajous curve be a tool for the recognition of intervals present in sound? How could this be applied to a single wave form resulting from the summation of waves of unknown frequencies and phase separations?
Making music with Strudel
A post about using Strudel to compose music inspired by Geese
My computer system for transcribing music from audio data is working at a basic level. The other end of my problem, to generate music that has been composed, was still unsolved. That is until I saw Switch Angel on youtube. She uses Strudel to create music using javascript with special musical functions which she explains for her watchers.
Live coding music with Strudel.
Strudel is the official javascript port of the Haskel program Tidal Cycles . The Haskell version looks cool, but I went with the zero-setup javascript option in browser at studel.cc. The user writes javascript to instruct an interpreter to generate music in the browser. It comes loaded with many instrument samples, drum machines, and synthesized instruments.
I have enjoyed putting on a song and trying to write something on the spot inspired by what I’m hearing. The other day I put on Getting Killed by Geese. To start, I set the cycles per minute using the setcpm function. It starts with a steady 4/4 rhythm somewhat energetic but a bit weighed down. I adjust the CPM value until it matches the intro I’m listening to. I create a four on the floor bass drum pattern with the s() function. This is an alias for sound() and saves four keystrokes.
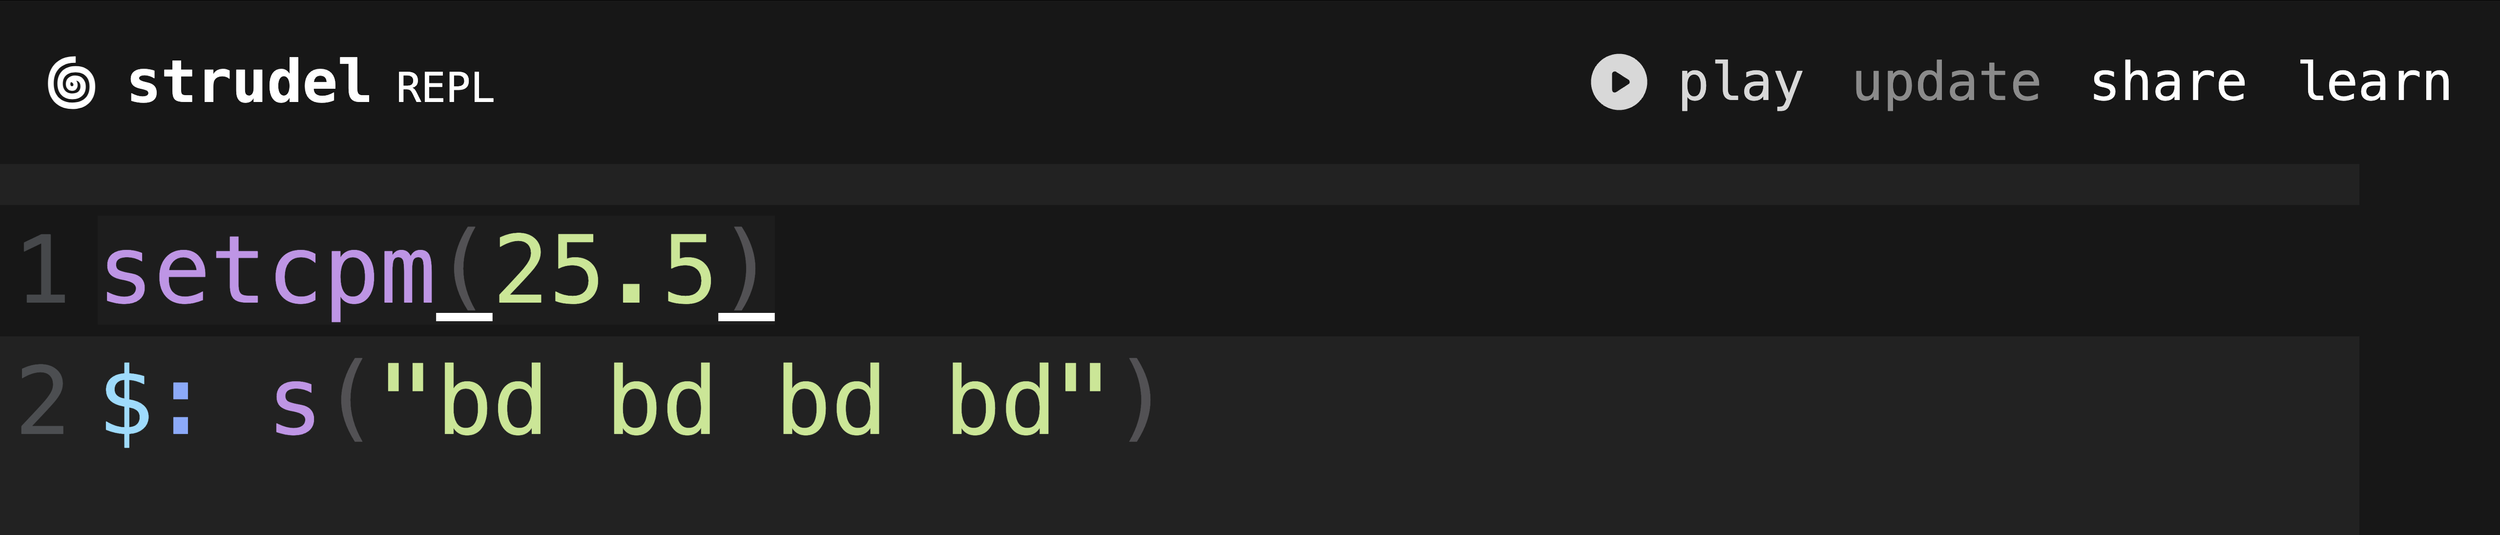
Four on the floor bass drum pattern
This means that strudel with generate music by playing 25.5 cycles per minute. If you write music in 4/4 time, this equates to 102 beats per minute.
Next, I’ll add a guitar part. For now I’ll keep it simple by repeating the tonic note F# four times. The duration of each note is divided equally around one cycle. So, by writing bd four times, I get four equally spaced notes in a cycle. Conventional music notation, this would be four quarter notes of F#.
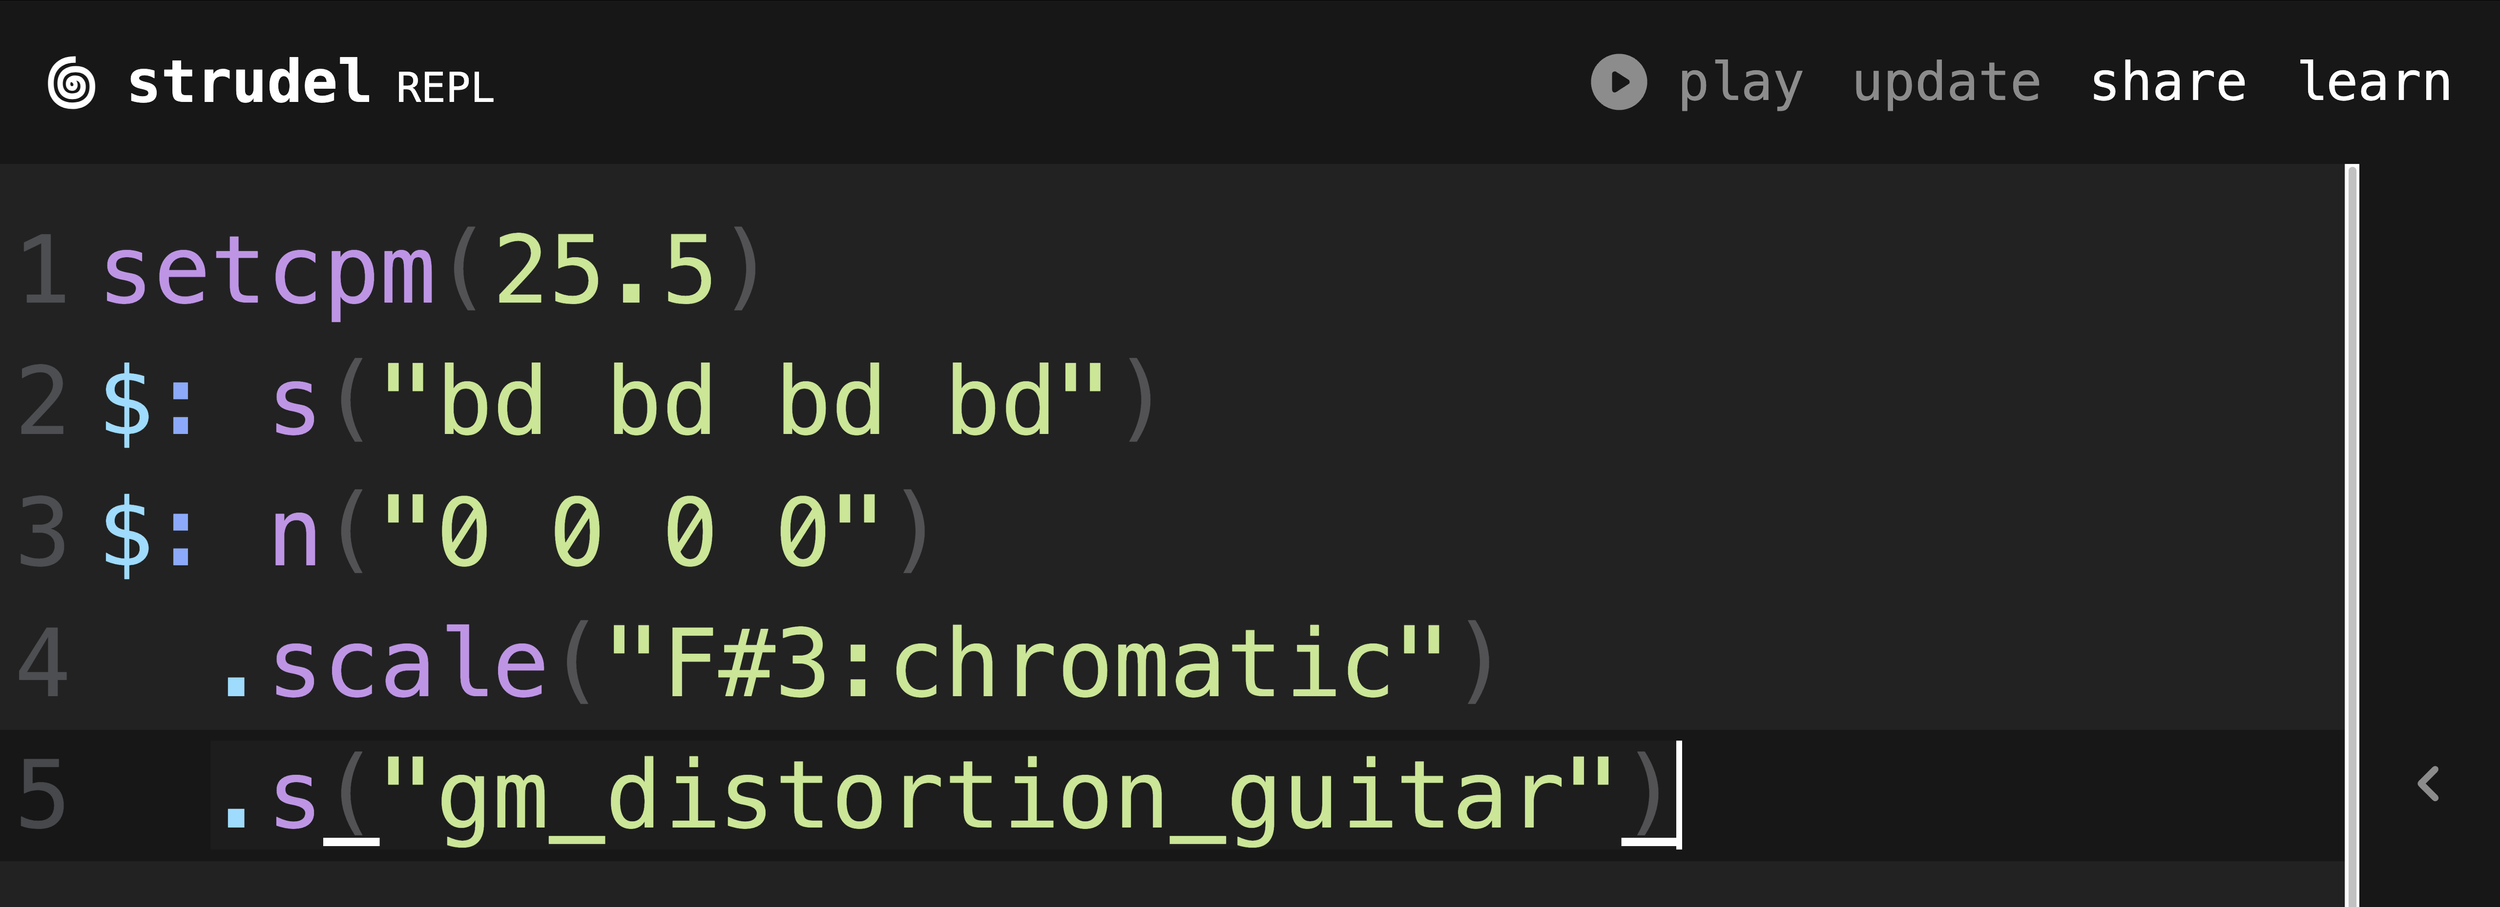
Adding a guitar part
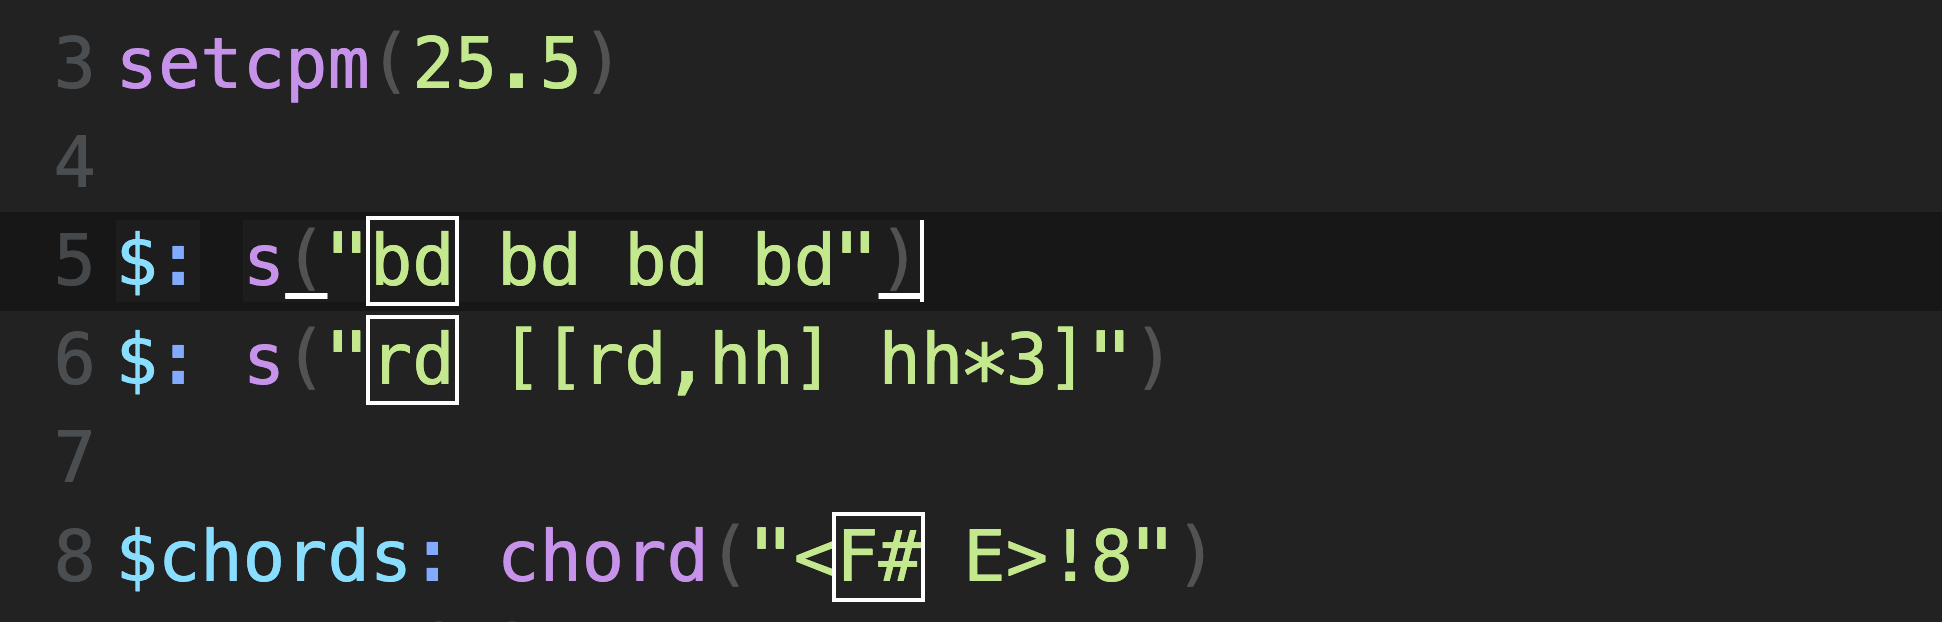
The intro to this song has a heavy distorted guitar chord part with two measures of F# and two measure of E. There are two ways to write chords. You can simply write the notes you want to use with commas and they will be played at the same time. This gives fine control over how chords are voice but requires some music theory knowledge. Another way to create chords is to use the chord() function which accepts chord names. By calling the .voicing() method on the output of the chord function, it creates notes that are in those chords. The voicing method gives you some control on how the notes of the chord are chosen. Here I am using both methods n() and chord().voicing() to create the chords of the song.
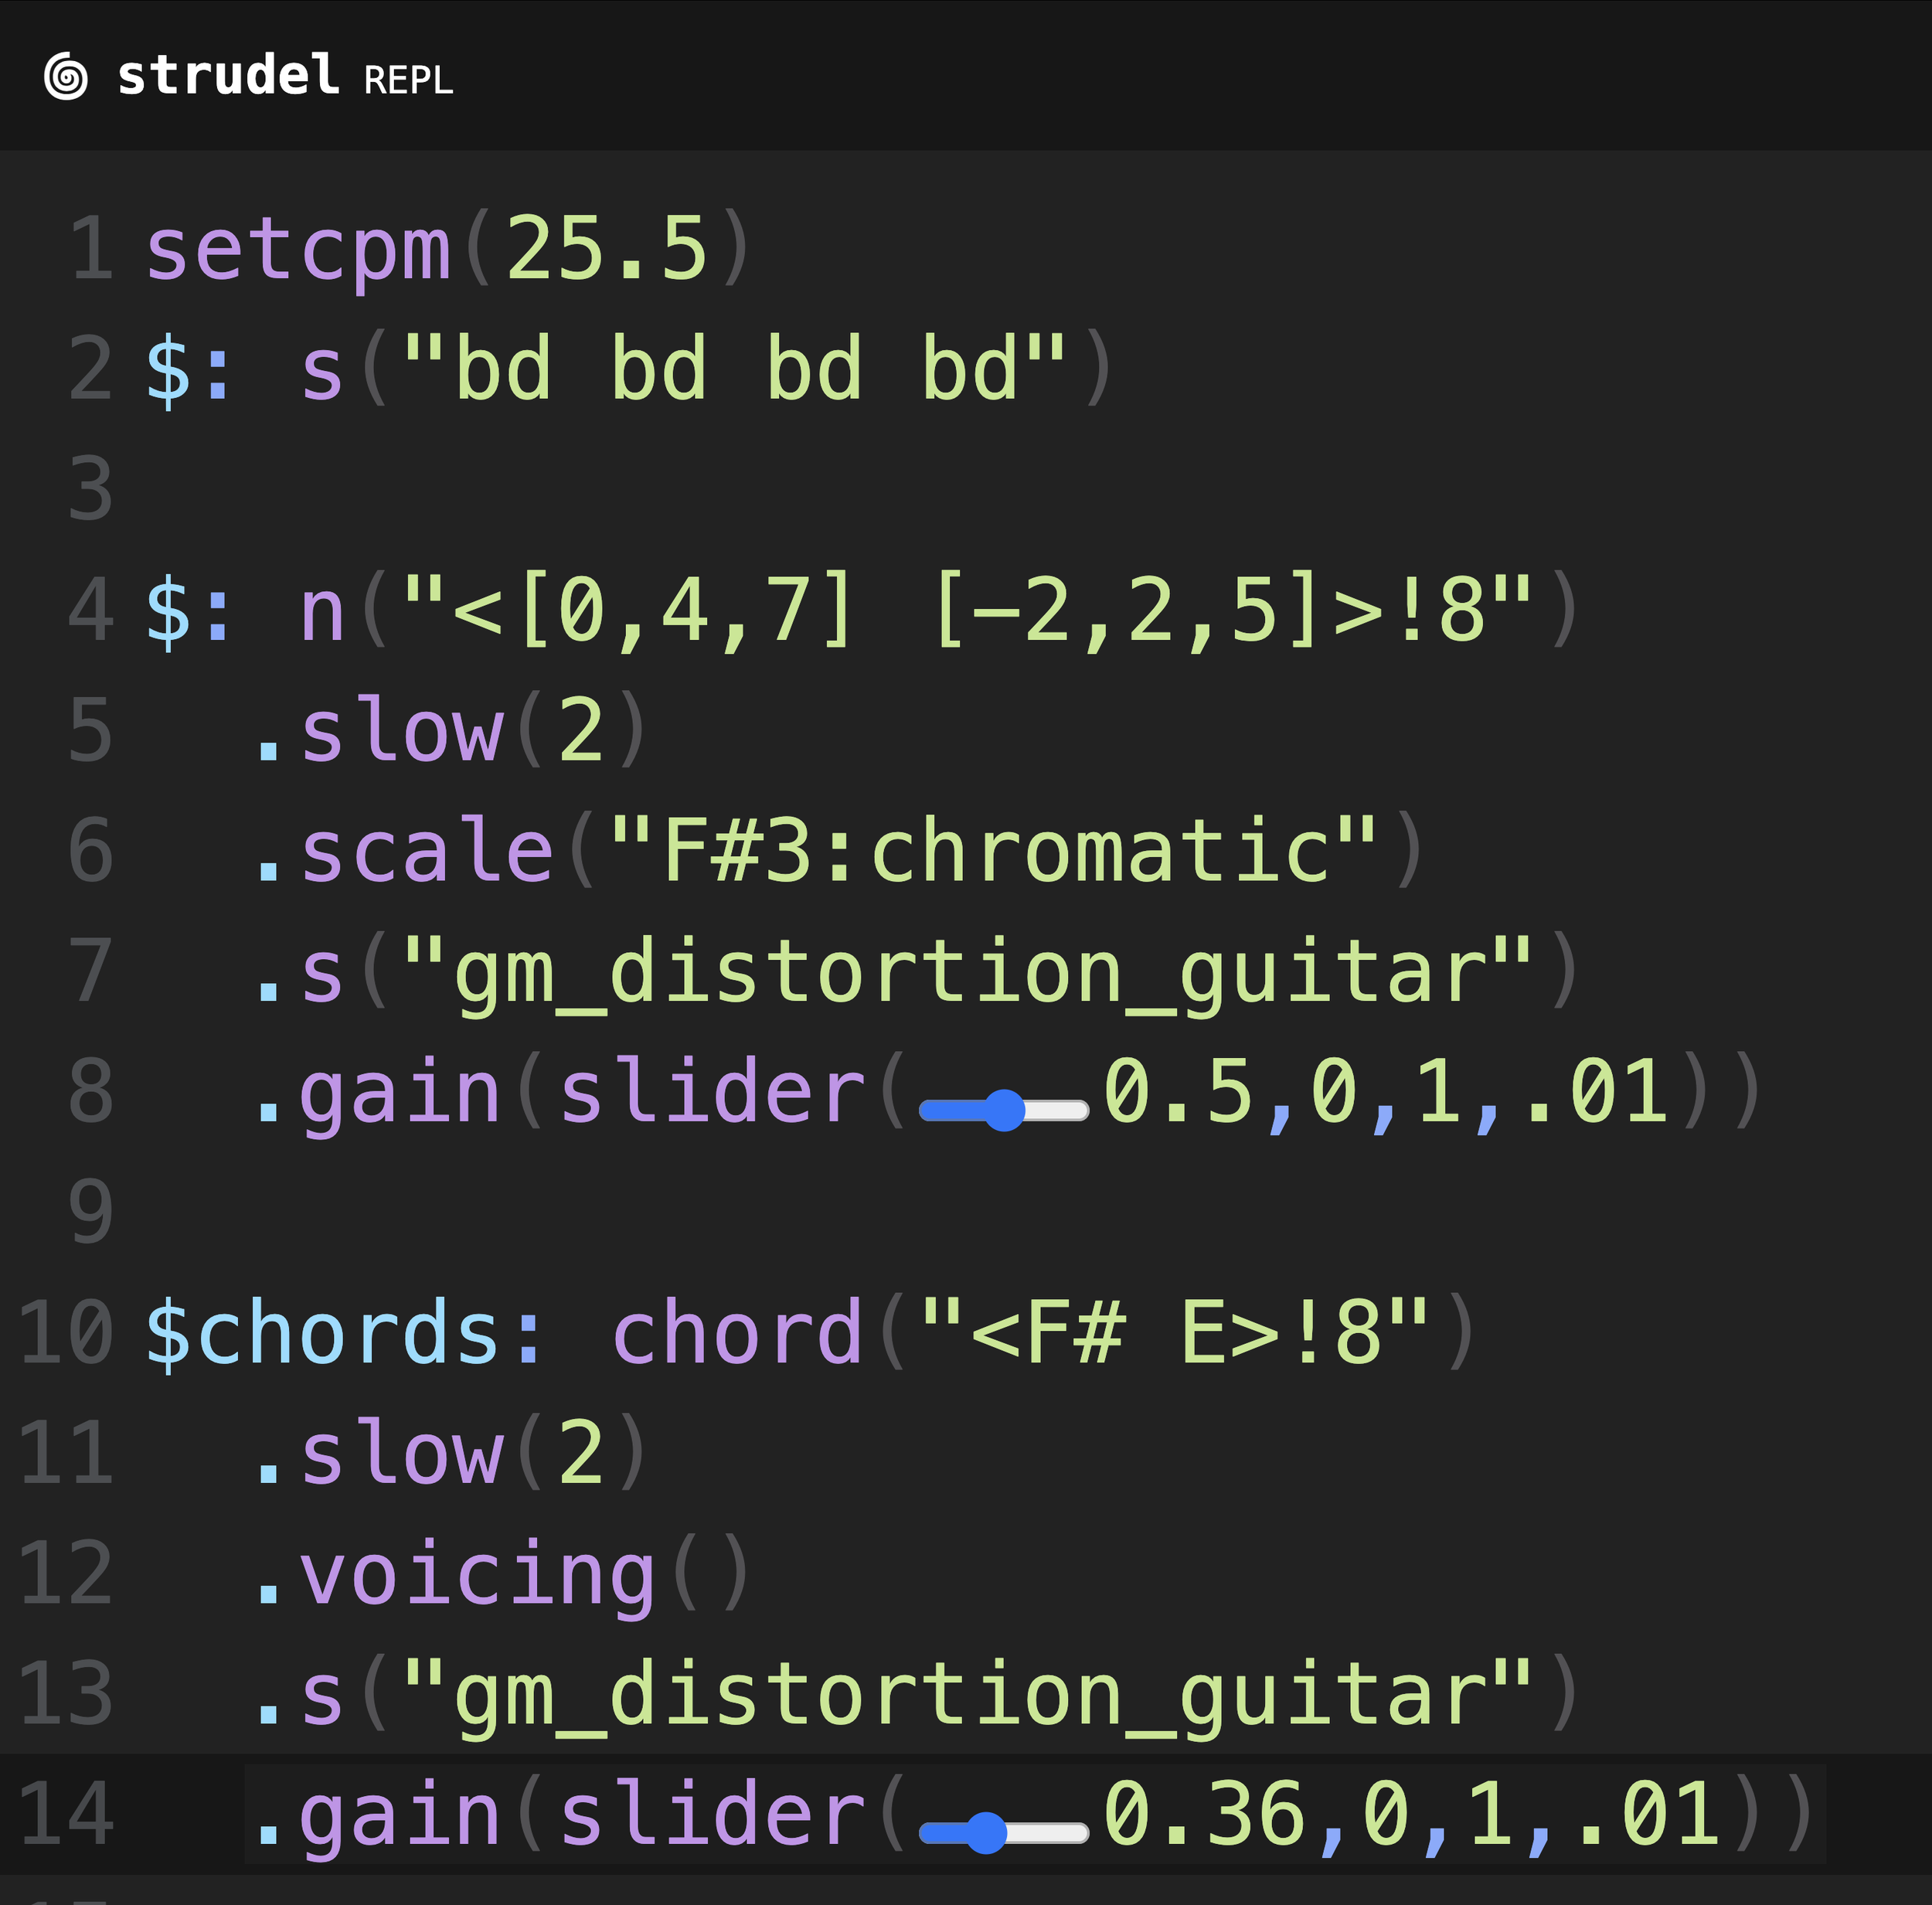
Two equivalent ways to create F# and E chords
The n(0,4,7) is a F# major chord. Similarly, n(-2,2,5) is an E chord. The numbers correspond to steps in the F# chromatic scale. I specify the scale to use by calling n(“<[0,4,7][-2,2,5]>”).scale(“F#3:chromatic”). The string input to n() uses mini notation. This notation comes from Tidal cycles, so you can refer to either the Strudel mini notation documentation or the Tidal Cycles mini notation documentation to see how it works. Mini notation uses <a b> to denote alternation between notes a and b, once each cycle. Using the !8 causes the cycle to use the first alternation item 8 times, then use the second alternation item 8 times. I want four beats per measure, so I slow down the rhythm by half using .slow(2). Now I have a four bar phrase F# F# E E that repeats.
Next, I’ll add a bass line.
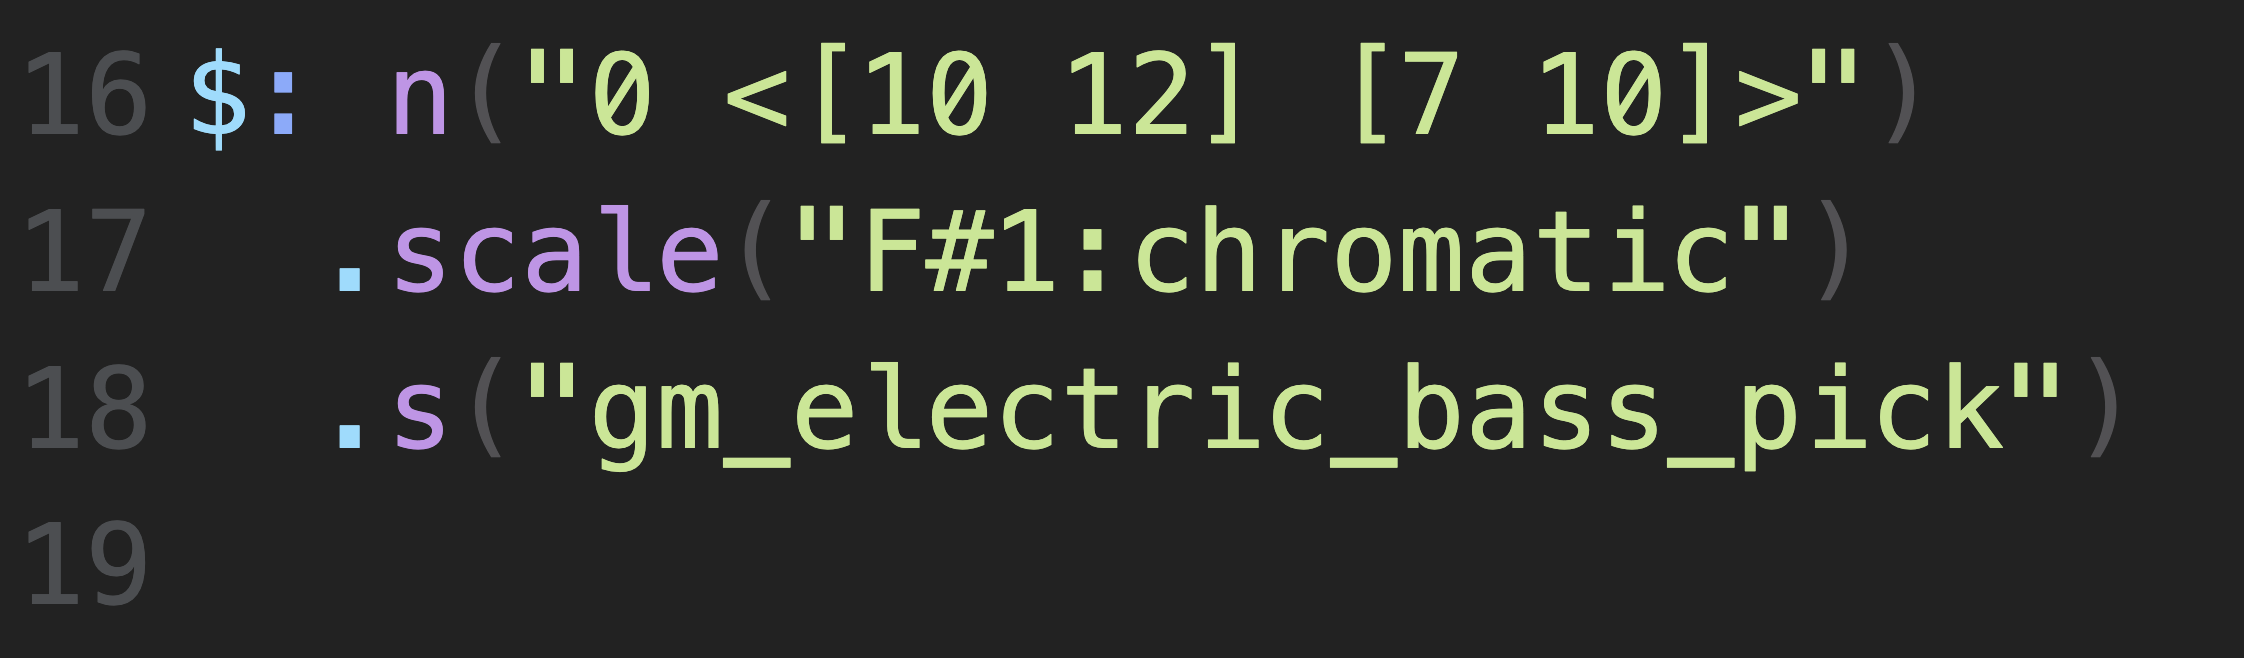
The bass uses a F#1:chromatic scale. So 0 (zero) represents the low F# on a bass guitar. I’m using the mini notation to create a pattern the alternates between 0 and one of two two-note phrases (E F# and C# E). Next I added some effects to the guitar and added a E# (the major 7th to F#) every four cycles. Then I added a vocal track. I tried singing to the reference song by Geese and I think the first note of the melody is the 5th, so the melody starts on number 7 (C#). Strudel does not have a voice generator I can find, so his lyrics won’t be included. The gm choir aahs synth gives a human like vocal quality but cannot be programmed with real words.
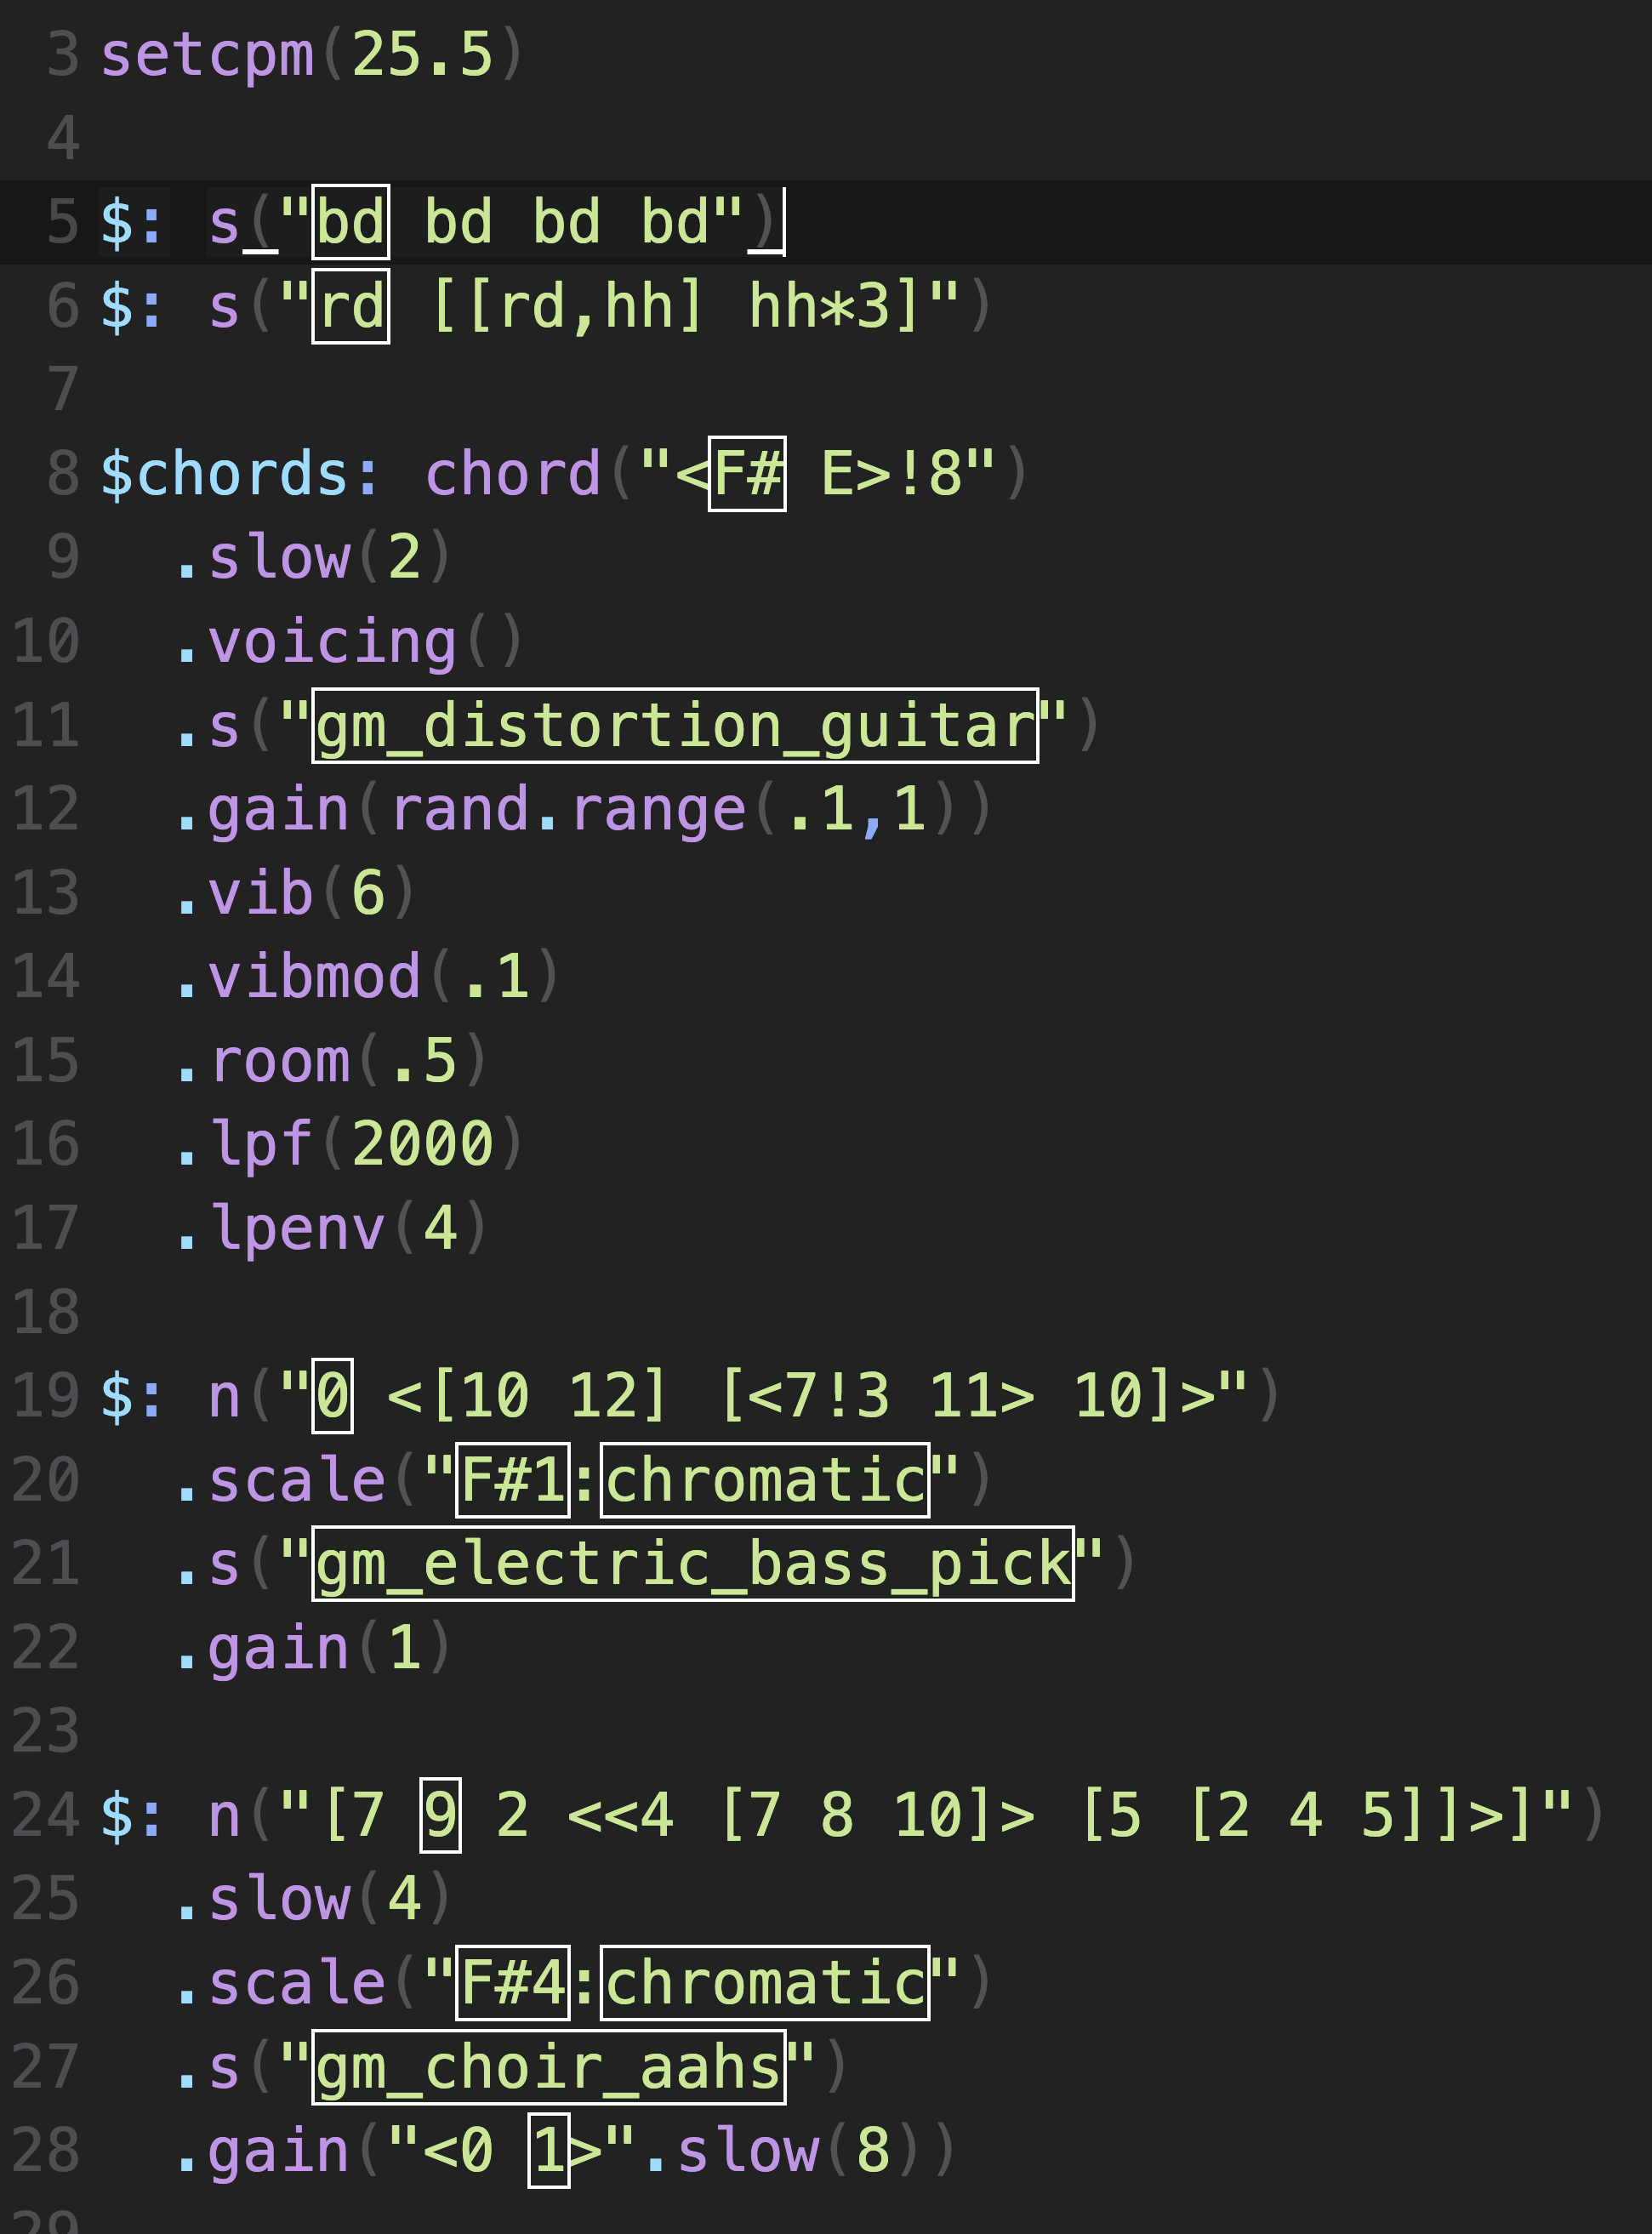
A bass line, vocal melody, and drum part inspired by Getting Killed by Geese
The vocal part I wanted to come in after 8 cycles. So I created a variable gain using mini notation and a .slow(8). This gives me a gain of 0 or 1, alternating every 8 cycles. So, I can hear the rest of the instruments first, then add the vocal melody after 8 measures. Doing this, the interpreter is playing the notes of the pattern, but they are not audible due to zero gain. Another way of achieving the same effect would be to write them as rests in the pattern. The actual notes I chose are not exactly the same as in the original song. They are inspired by it.
An algorithm to detect chords
how i developed an app to detect chords in sound data
I started the summer 2024 with a desire to learn bossa nova music on guitar. I ended that year trying to create a codebase to help me identify notes and chords on guitar. And I am doing so with the dream of creating a musical AI assistant to help me learn how to improvise music like the professionals. How’s it going? I have a system for labeling sound data and creating models to predict the labels using the sound’s frequency spectrum.
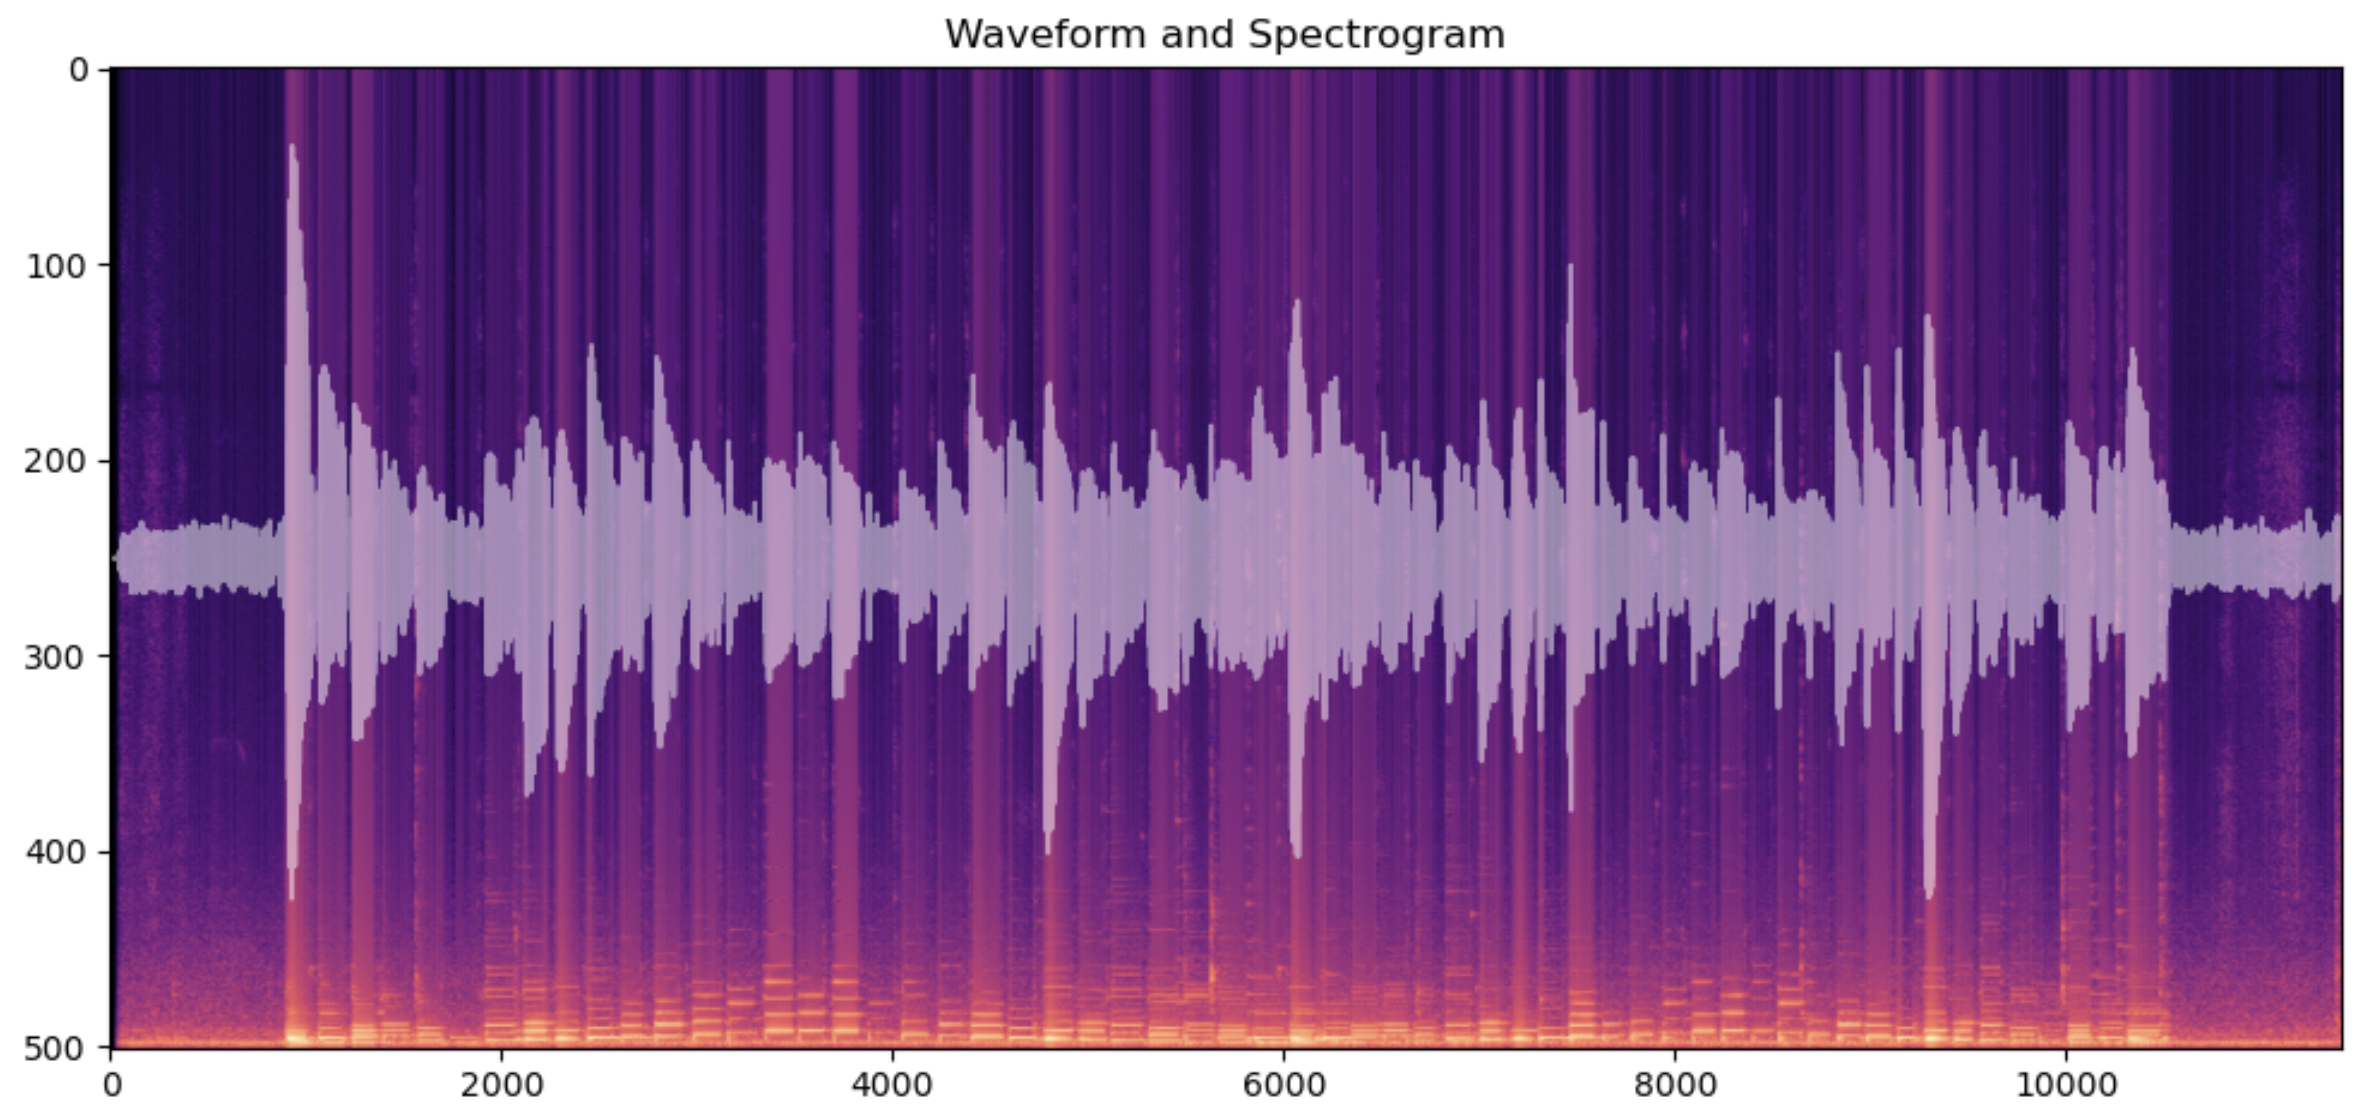
Here I have played a G major scale, two octaves, up and down twice. The light colored spikes around the centerline are the waveform. The colorful bands in the background are a spectrogram. Spectrogram is an image created by a series of fourier transforms on windows of the sound data. This is the short time fourier transform (STFT). This transformation takes a vector of sound data and sweeps a window function over it. This window function outputs a vector of numbers representing how much each frequency is present in the window. Which frequencies? They are a series of discrete waves that fit inside the window. So their frequencies are integer multiples of the fundamental frequency, the one whose wave fit exactly one period inside the window. The calculation of these fourier coefficients is sped up by a technique discovered by John Tukey known as the fast fourier transform.
The result is a vector of values the correspond to the presence of a frequency in the window. By sweeping the fourier transform window over the sound data, we get 2 dimensional data. One dimensions is the time that is tied to the window. The other dimension is the frequency value of each component in the Fourier series. Since the data is now 2 dimensional, so it is natural to plot it as a heatmap image. The scale used below is viridis, giving a blue to green to yellow color based on a pixel’s value. This image data is what will be used to predict the label of the sound.
Parameters of the short time fourier transform (STFT)
G major scale, ascending two octaves, then descending two diatonic steps to E. Sample rate 44100 samples per second, Fourier gaussian window size 2000 samples with sigma=1000, hop size 200 samples.
Using python Dash, I set up a visual interface where I can select regions of the sound and label them. I used my ear to identify the notes and label them manually. The interface allows me to select a region of time, play it to ensure I’ve selected the correct area, and enter a label and save it to a json file on the server. This was my first attempt. In subsequent attempts I split and clustered the sounds so increase the efficiency of labeling.
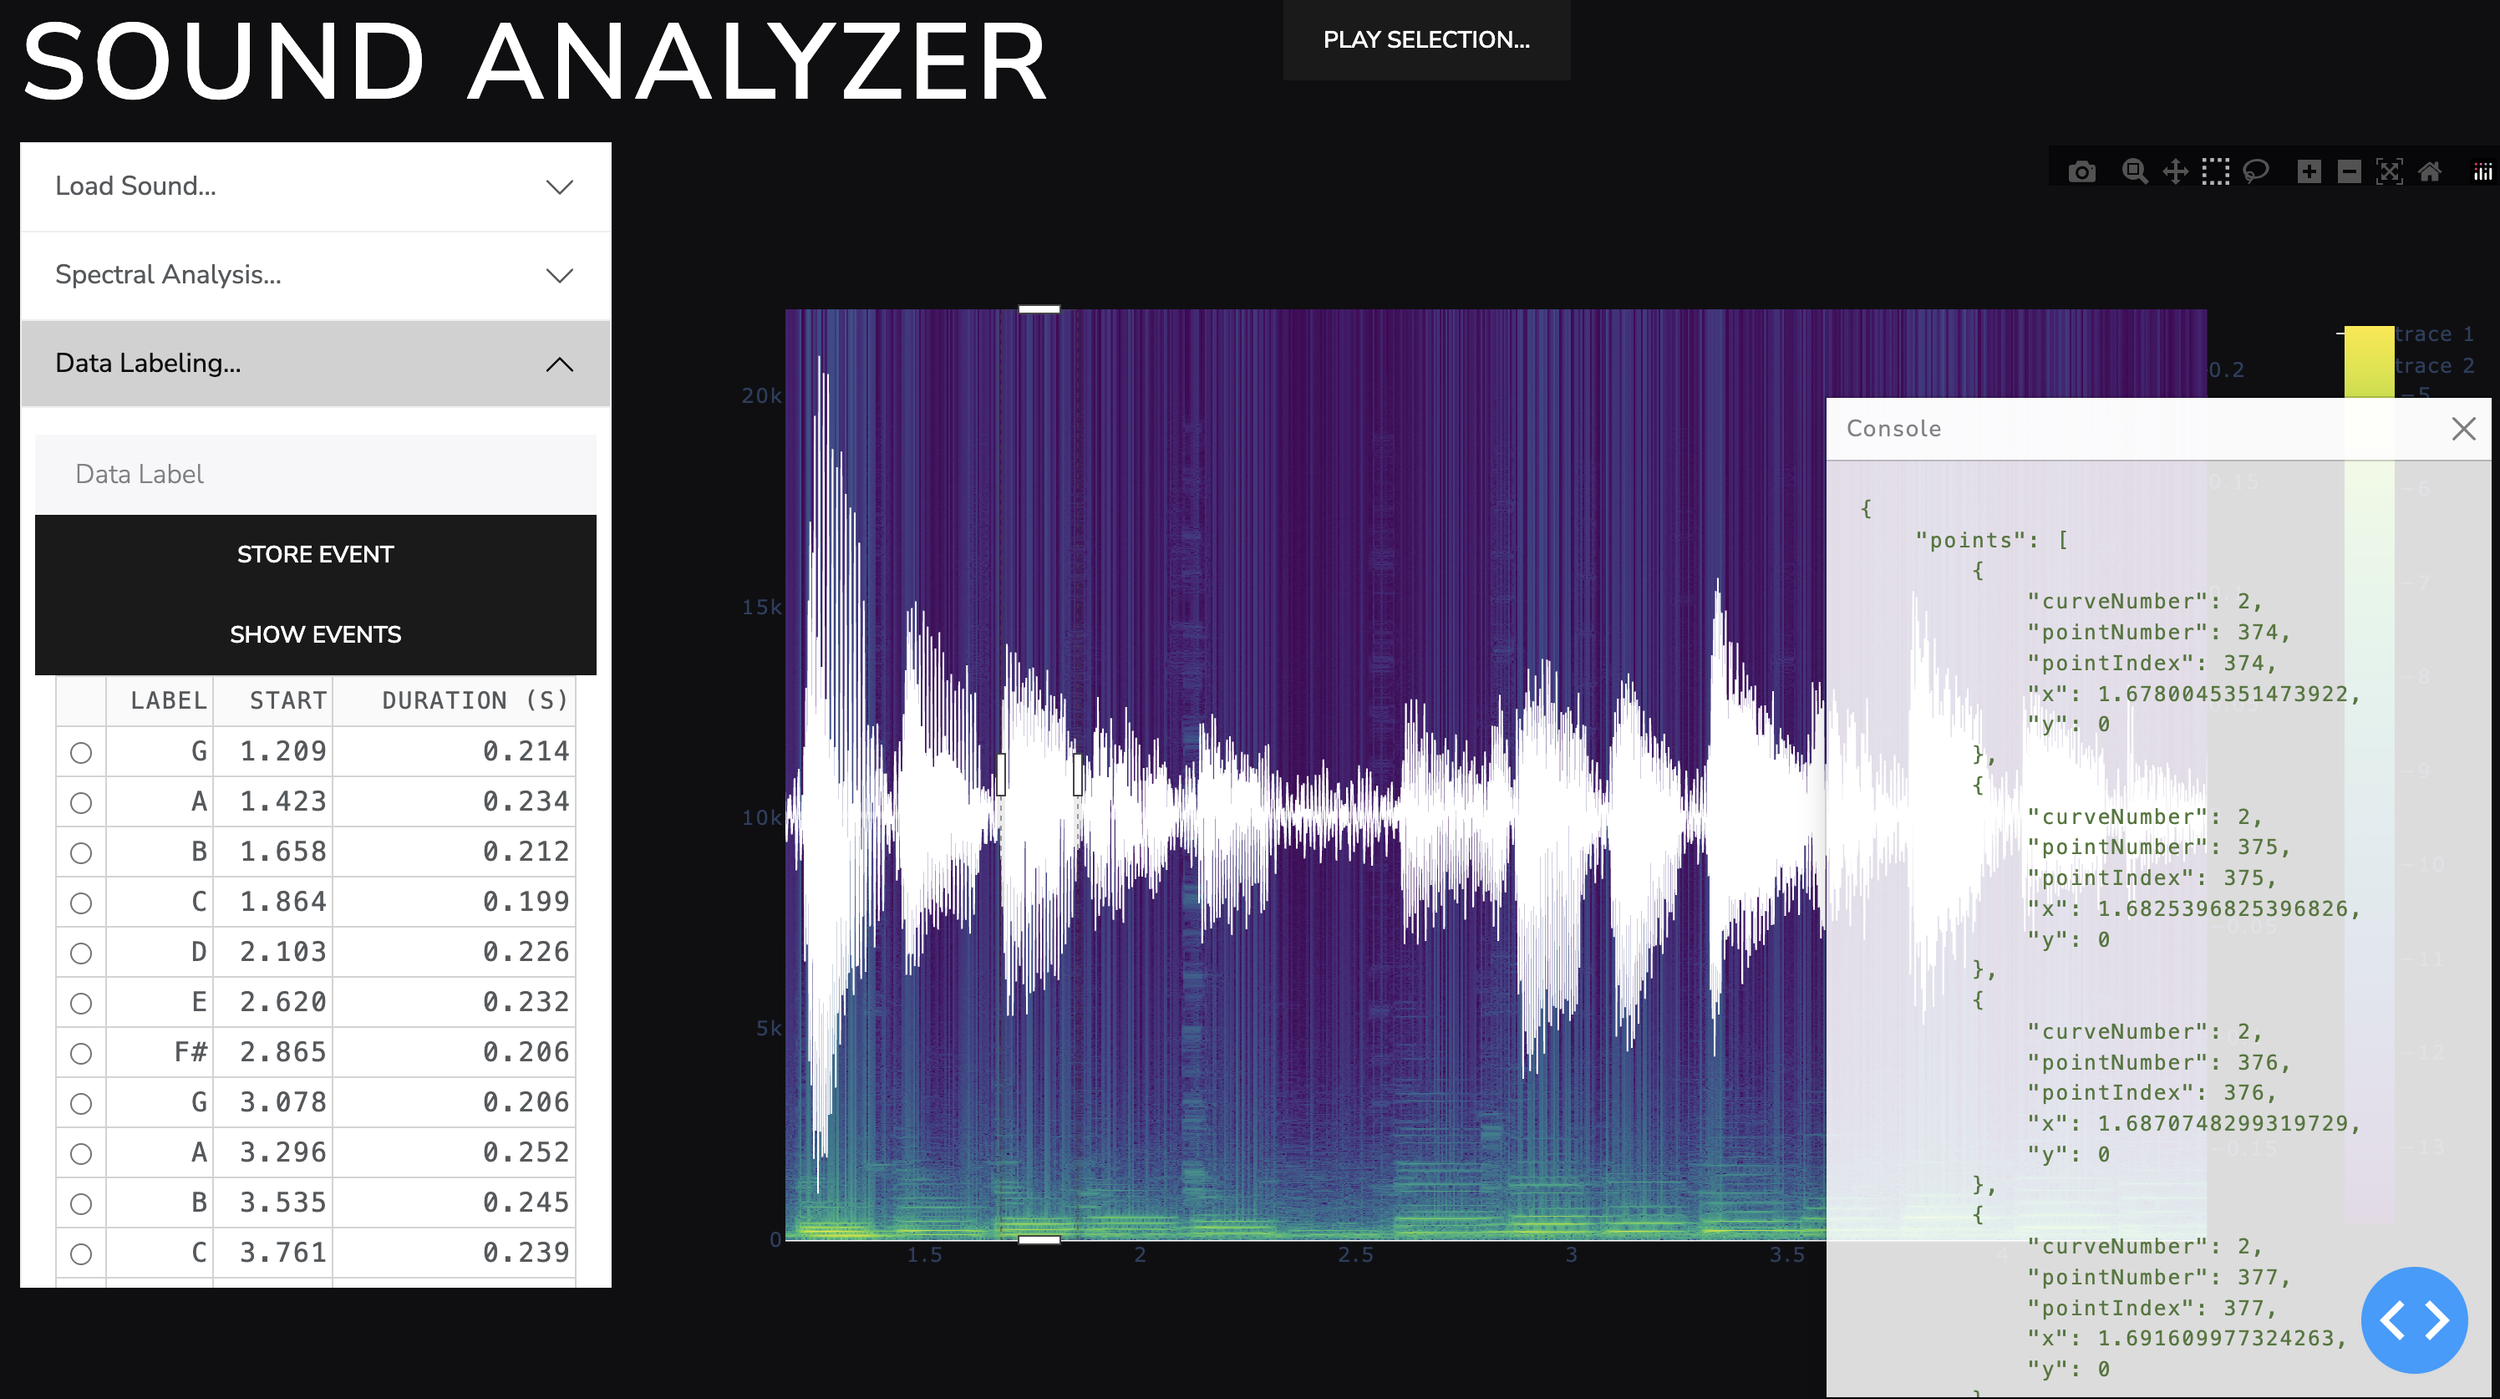
The labeling interface of my custom sound analyze app.
I reduced the spectra dimension from 1001 to 16 using a basic linear technique called principal component analysis (PCA). This produces variance maximizing components that can reconstruct the original spectra with some error. The components are what I will use to cluster the sounds by similar harmonic content. This step was not completely necessary, but in reducing the dimension of the predictor space, it reduced the time required to fit the classification models at the end.
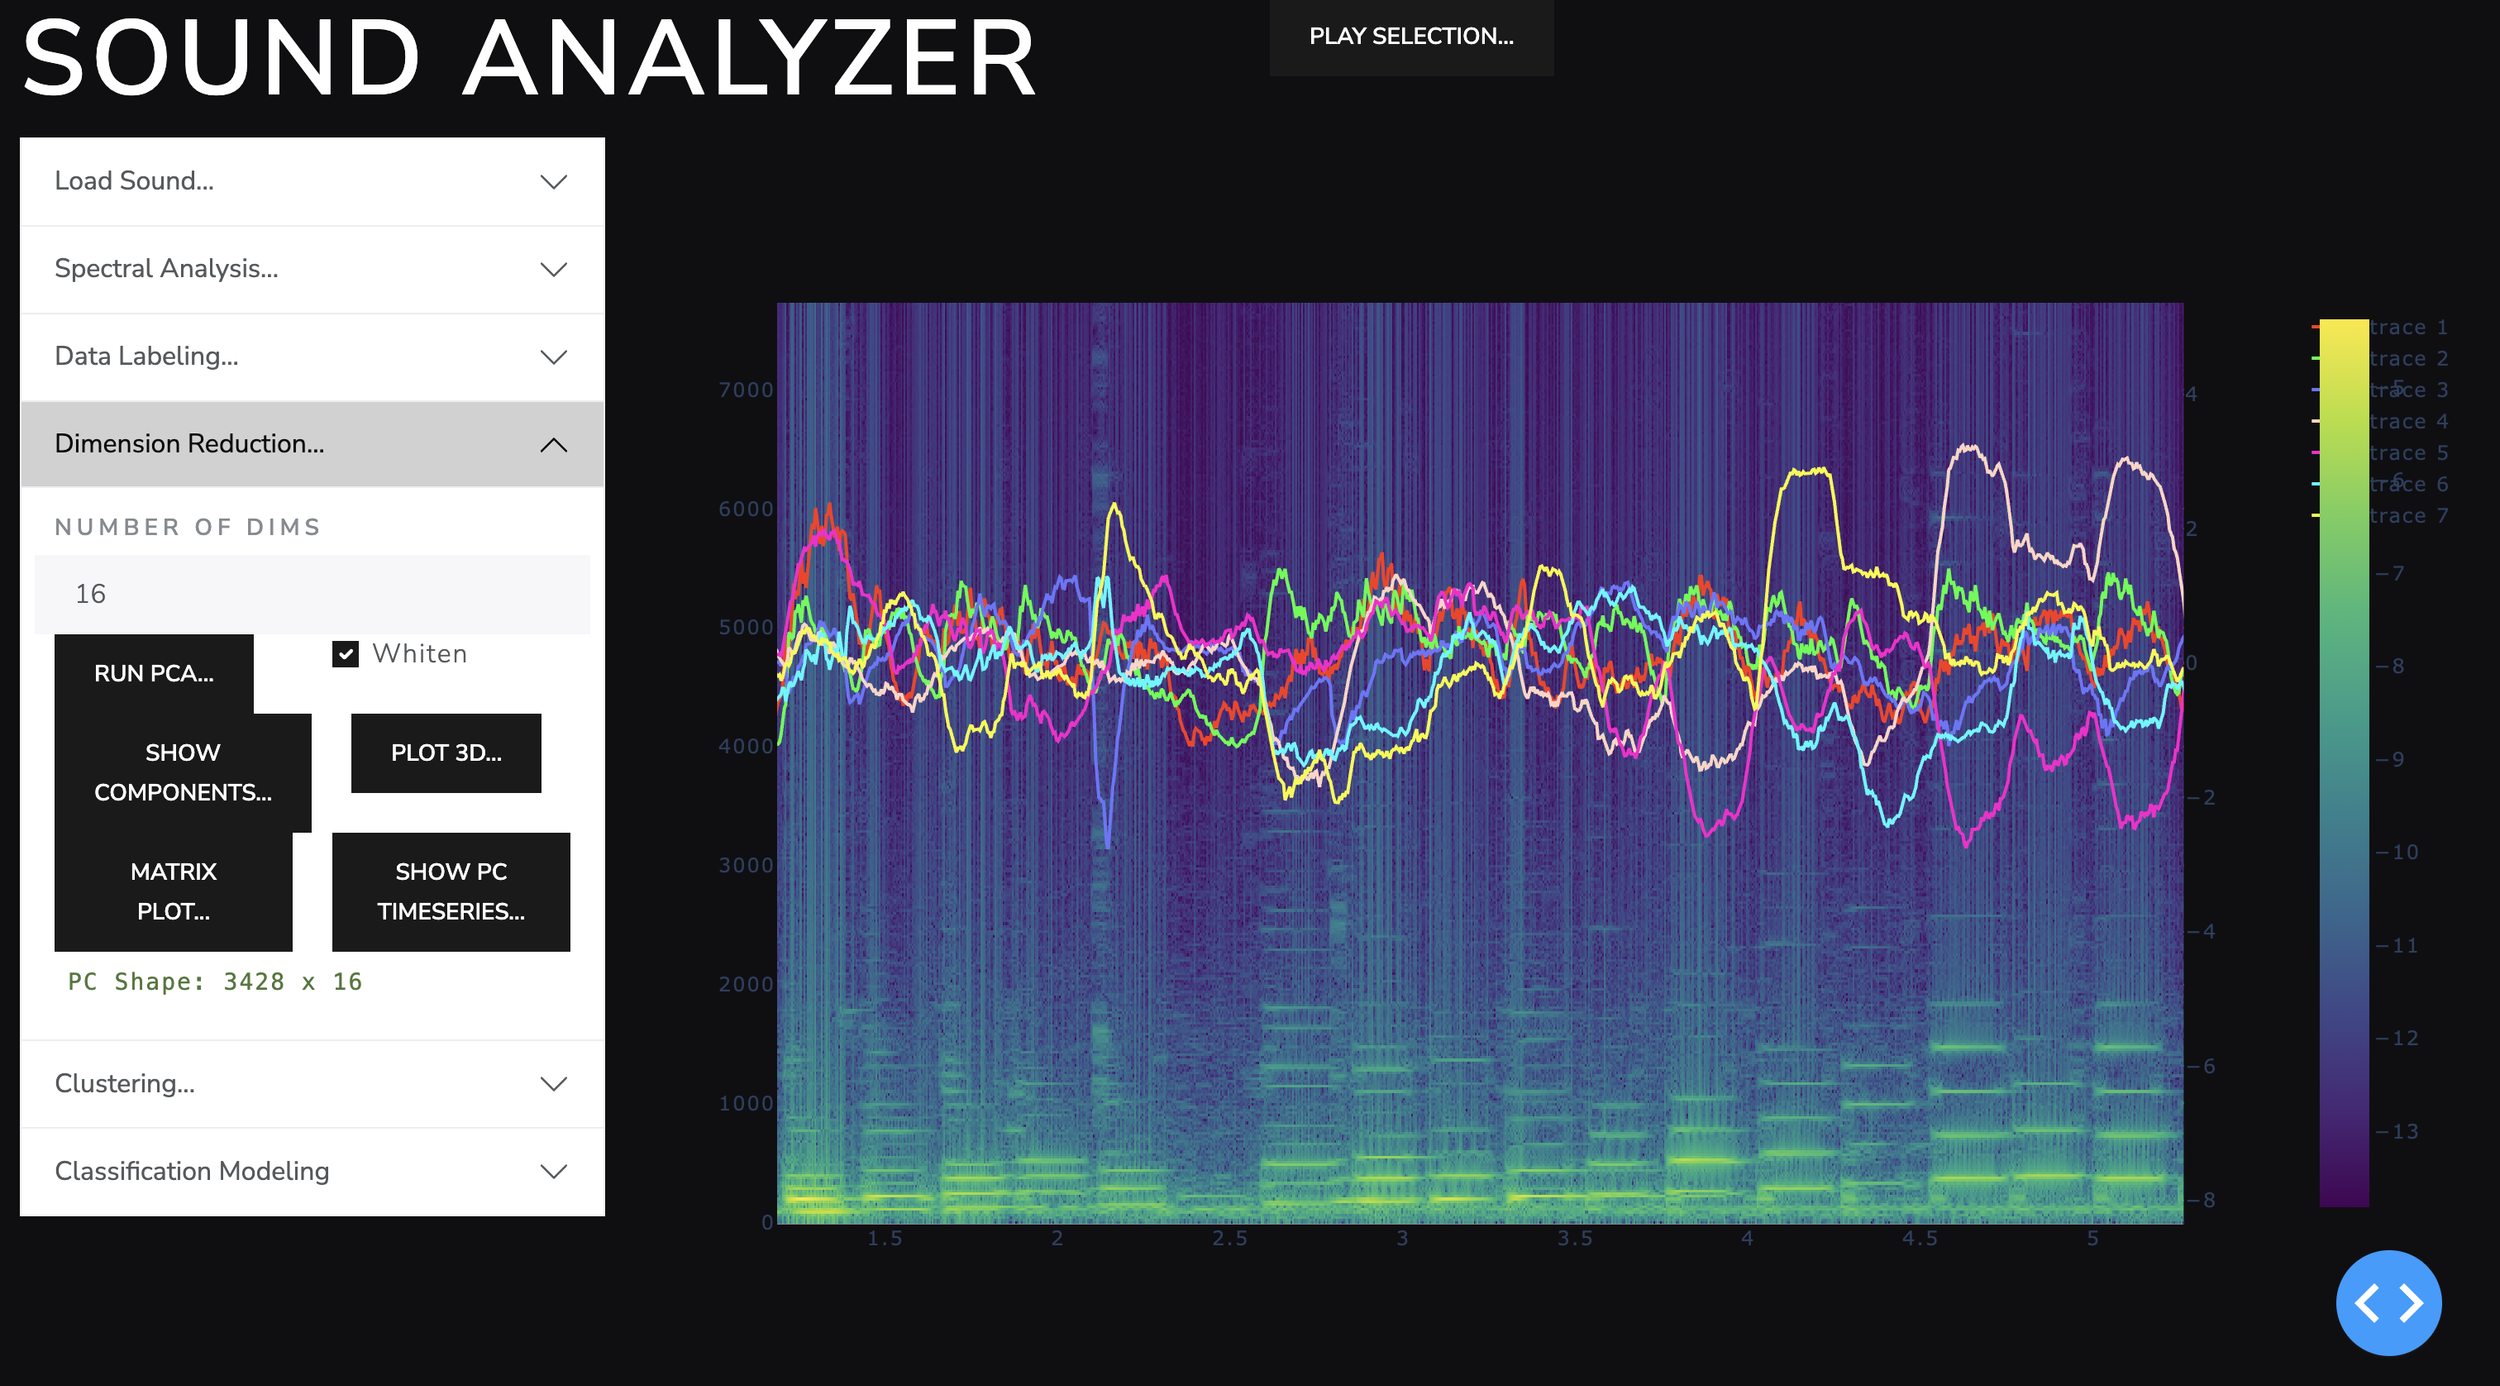
a time series of the principal components of the frequency spectra. These component values through time were what I used to cluster the sounds.
The clustering algorithm chosen was Agglomerative clustering. Kmeans did not do a good job, and agglomerative worked much better. Additional algorithms were not tested. The UI is built to allow user to click through the individual regions of time identified by the clustering algorithm. Because the clusters could oscillate between different clusters as points when notes changed, I also included a temporal-smoothing algorithm for cluster label. It turned out that sometimes the individual cluster was just noise. Some clusters showed specific notes often in multiple octaves. The note G appeared in 3 octaves, the rest of the notes appear in two different octaves. It was pleasing that the unsupervised algorithm (clustering) did a good job at putting together things were fundamentally similar but not exactly the same.
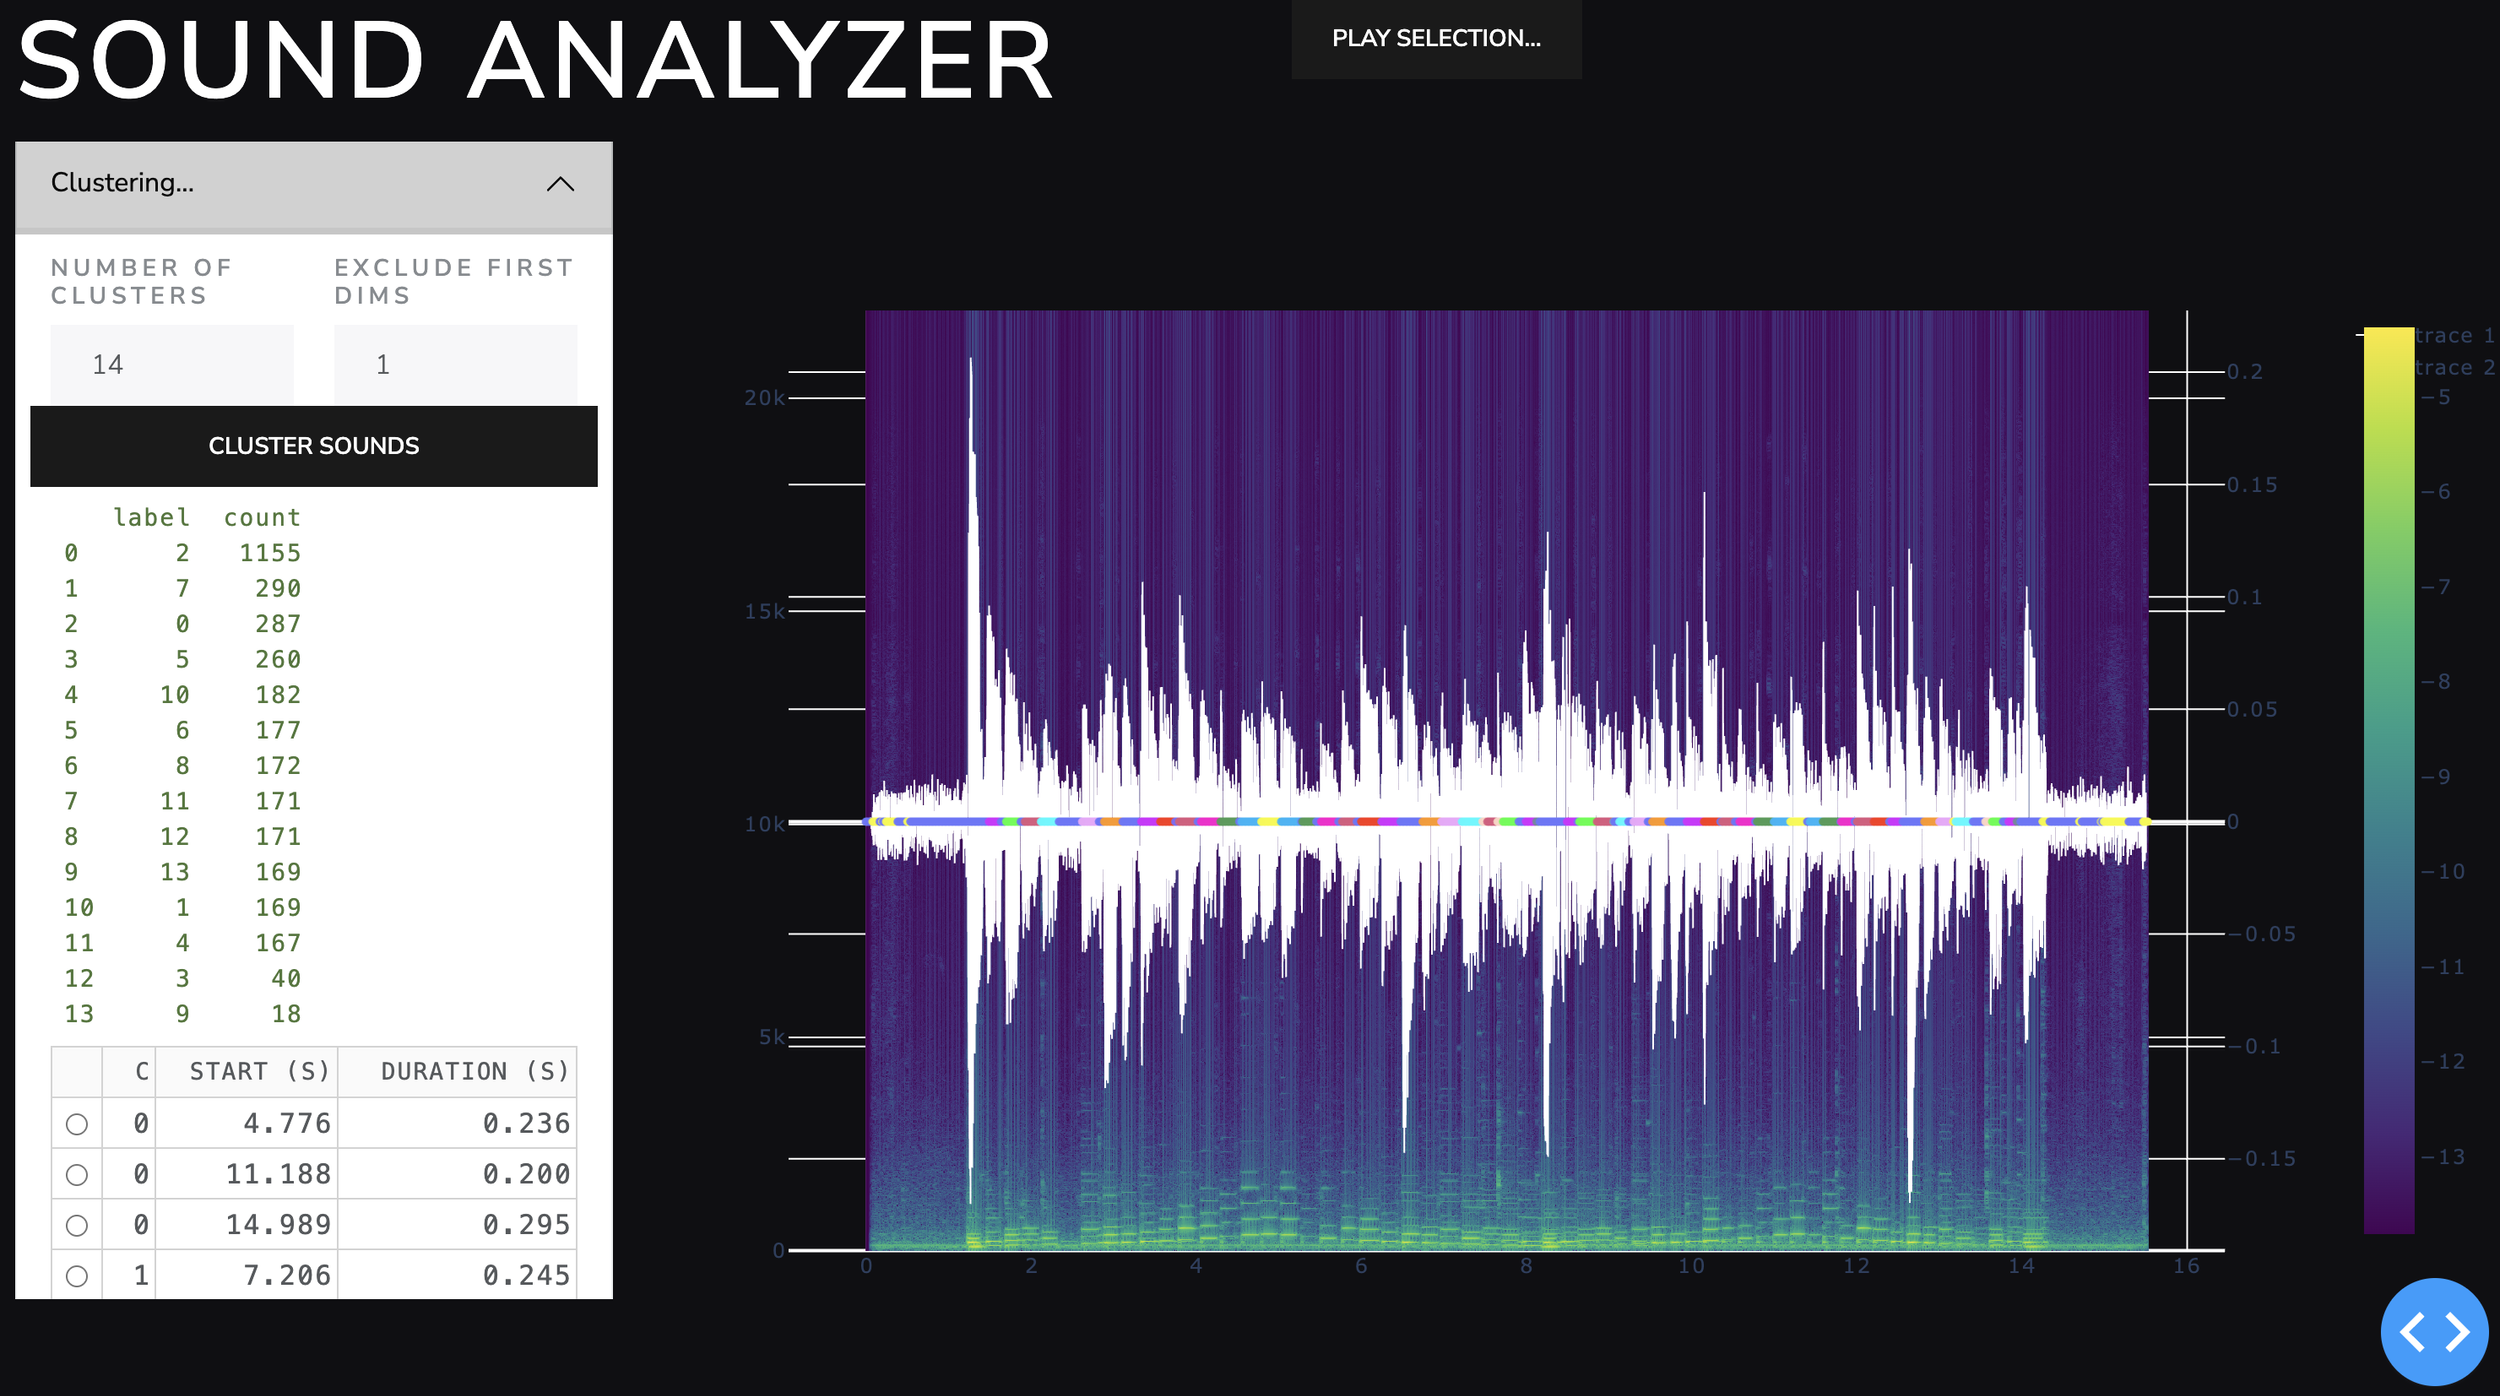
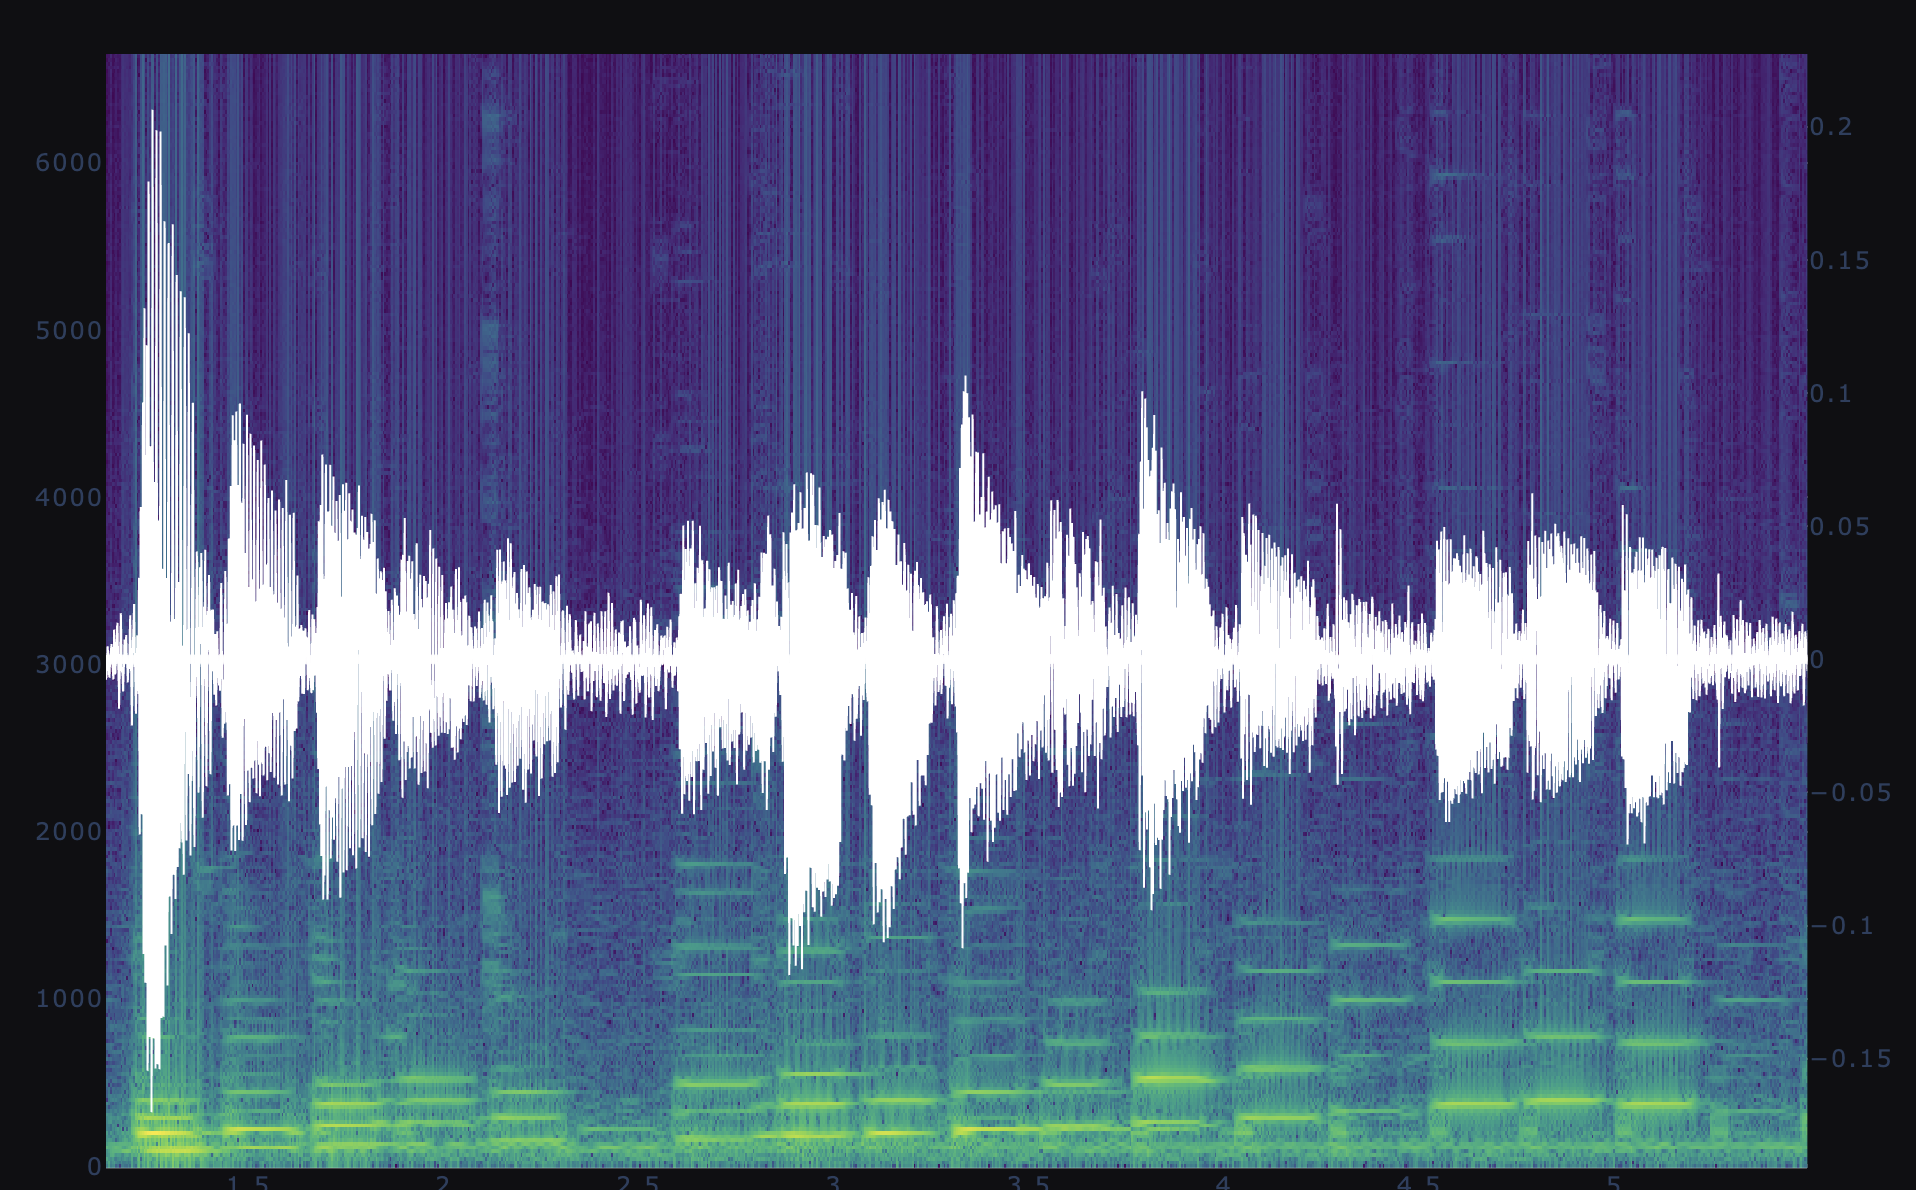
The spectrogram with sound wave form overlayed. Harmonic clusters shown as colored dots at the midline of the graph.
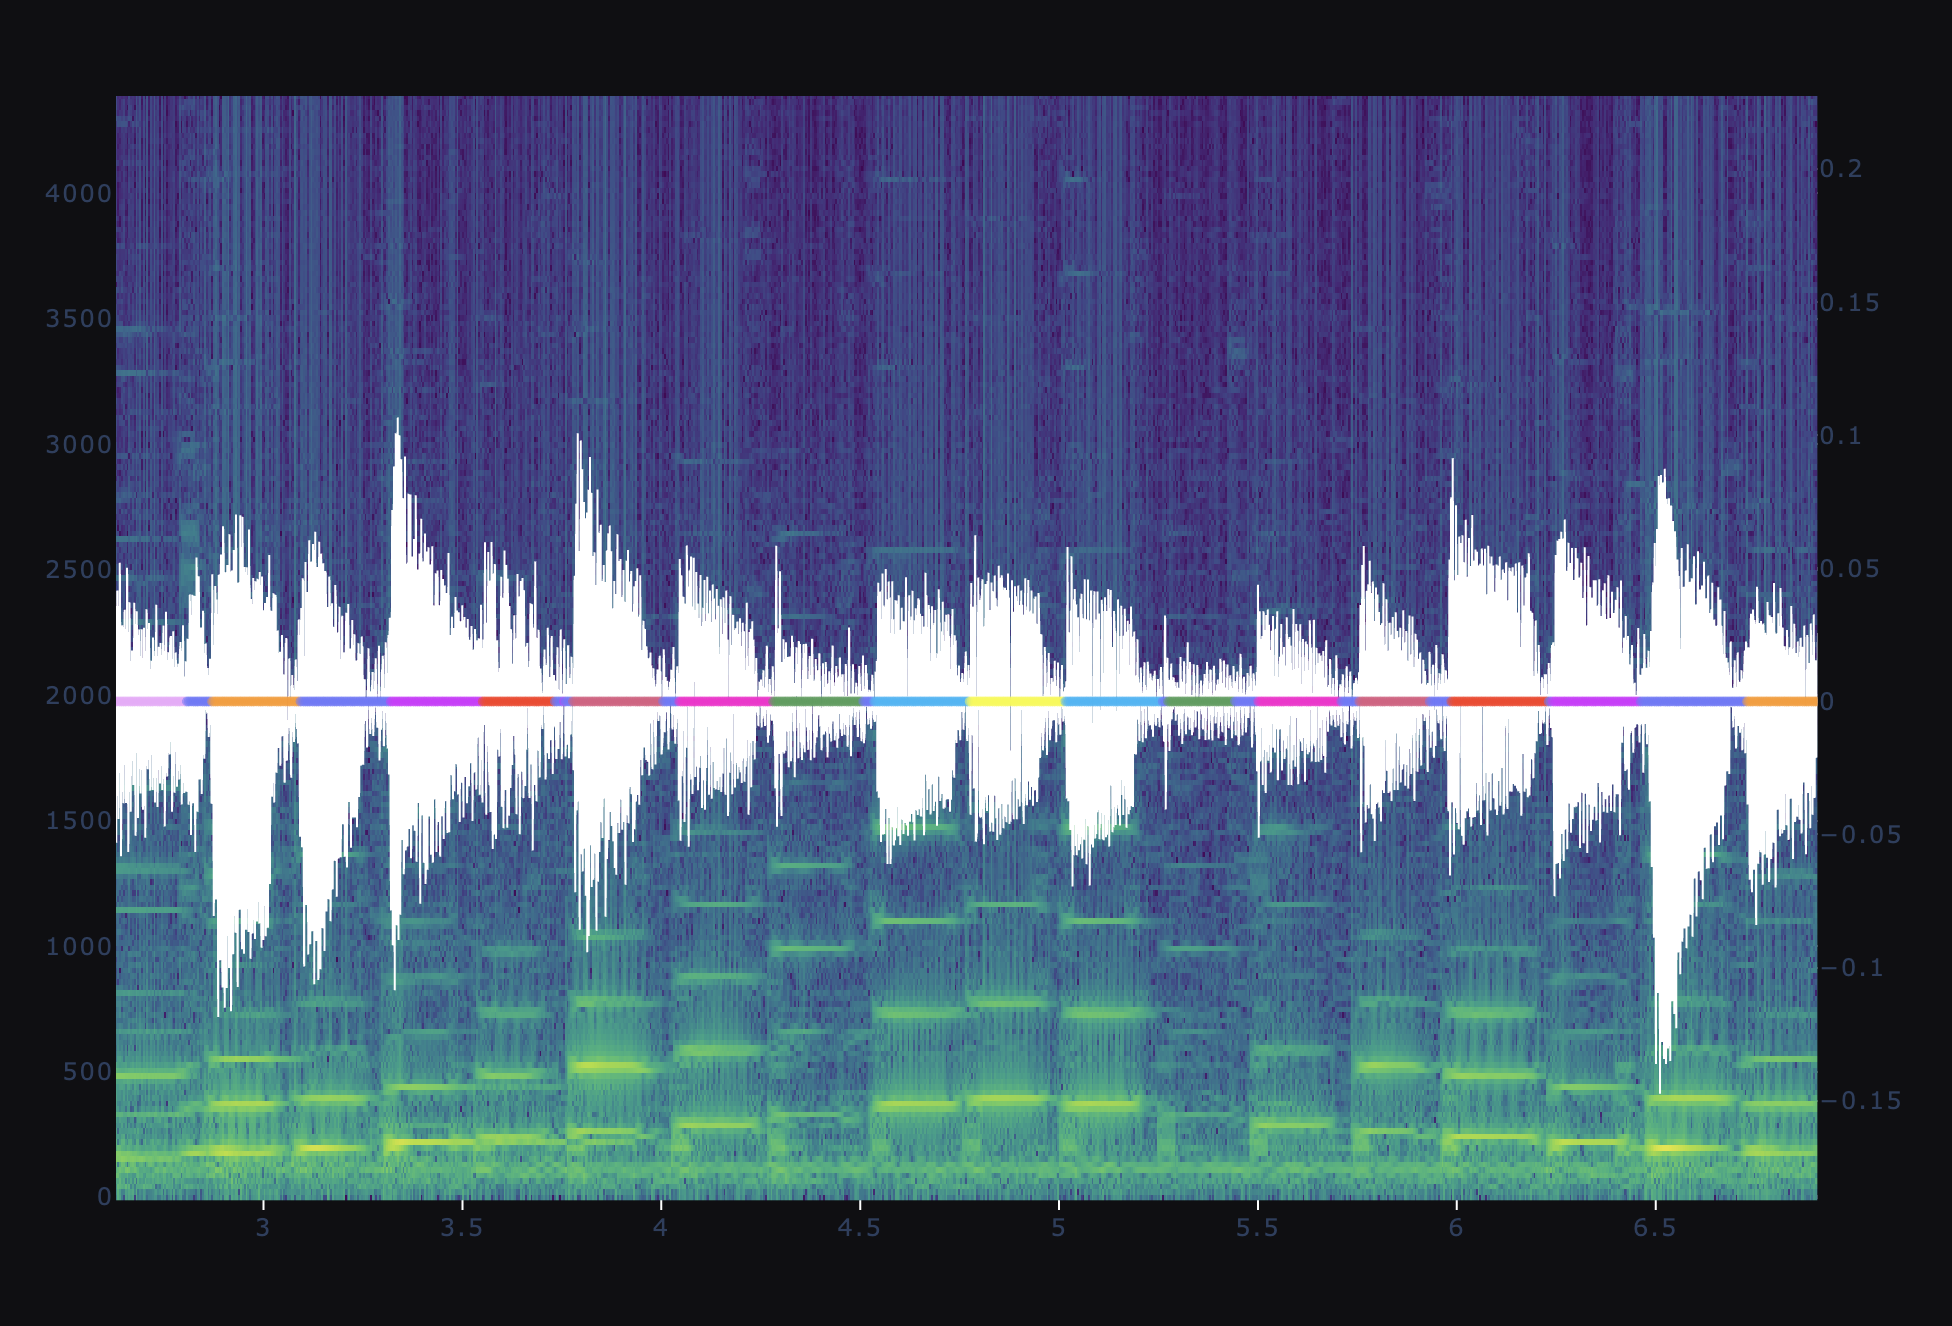
Part of the G major scale. Cluster labels shown as colors are symmetric about the highest note, G, as expected.
Now I needed to employ a supervised algorithm, an algorithm that is trained to predict a target. I had clusters which contained notes of similar harmonic content. But I wanted an algorithm that could detect and name specific content in sound.
Below is the prediction made by a random forest classifier trained to predict note label given spectrum principal components. The prediction probability is highest for the notes the model is trained on. The subsequent note that were not included in the training data show lower predicted probability. Additional training on more notes, would improve overall ability to identify notes.
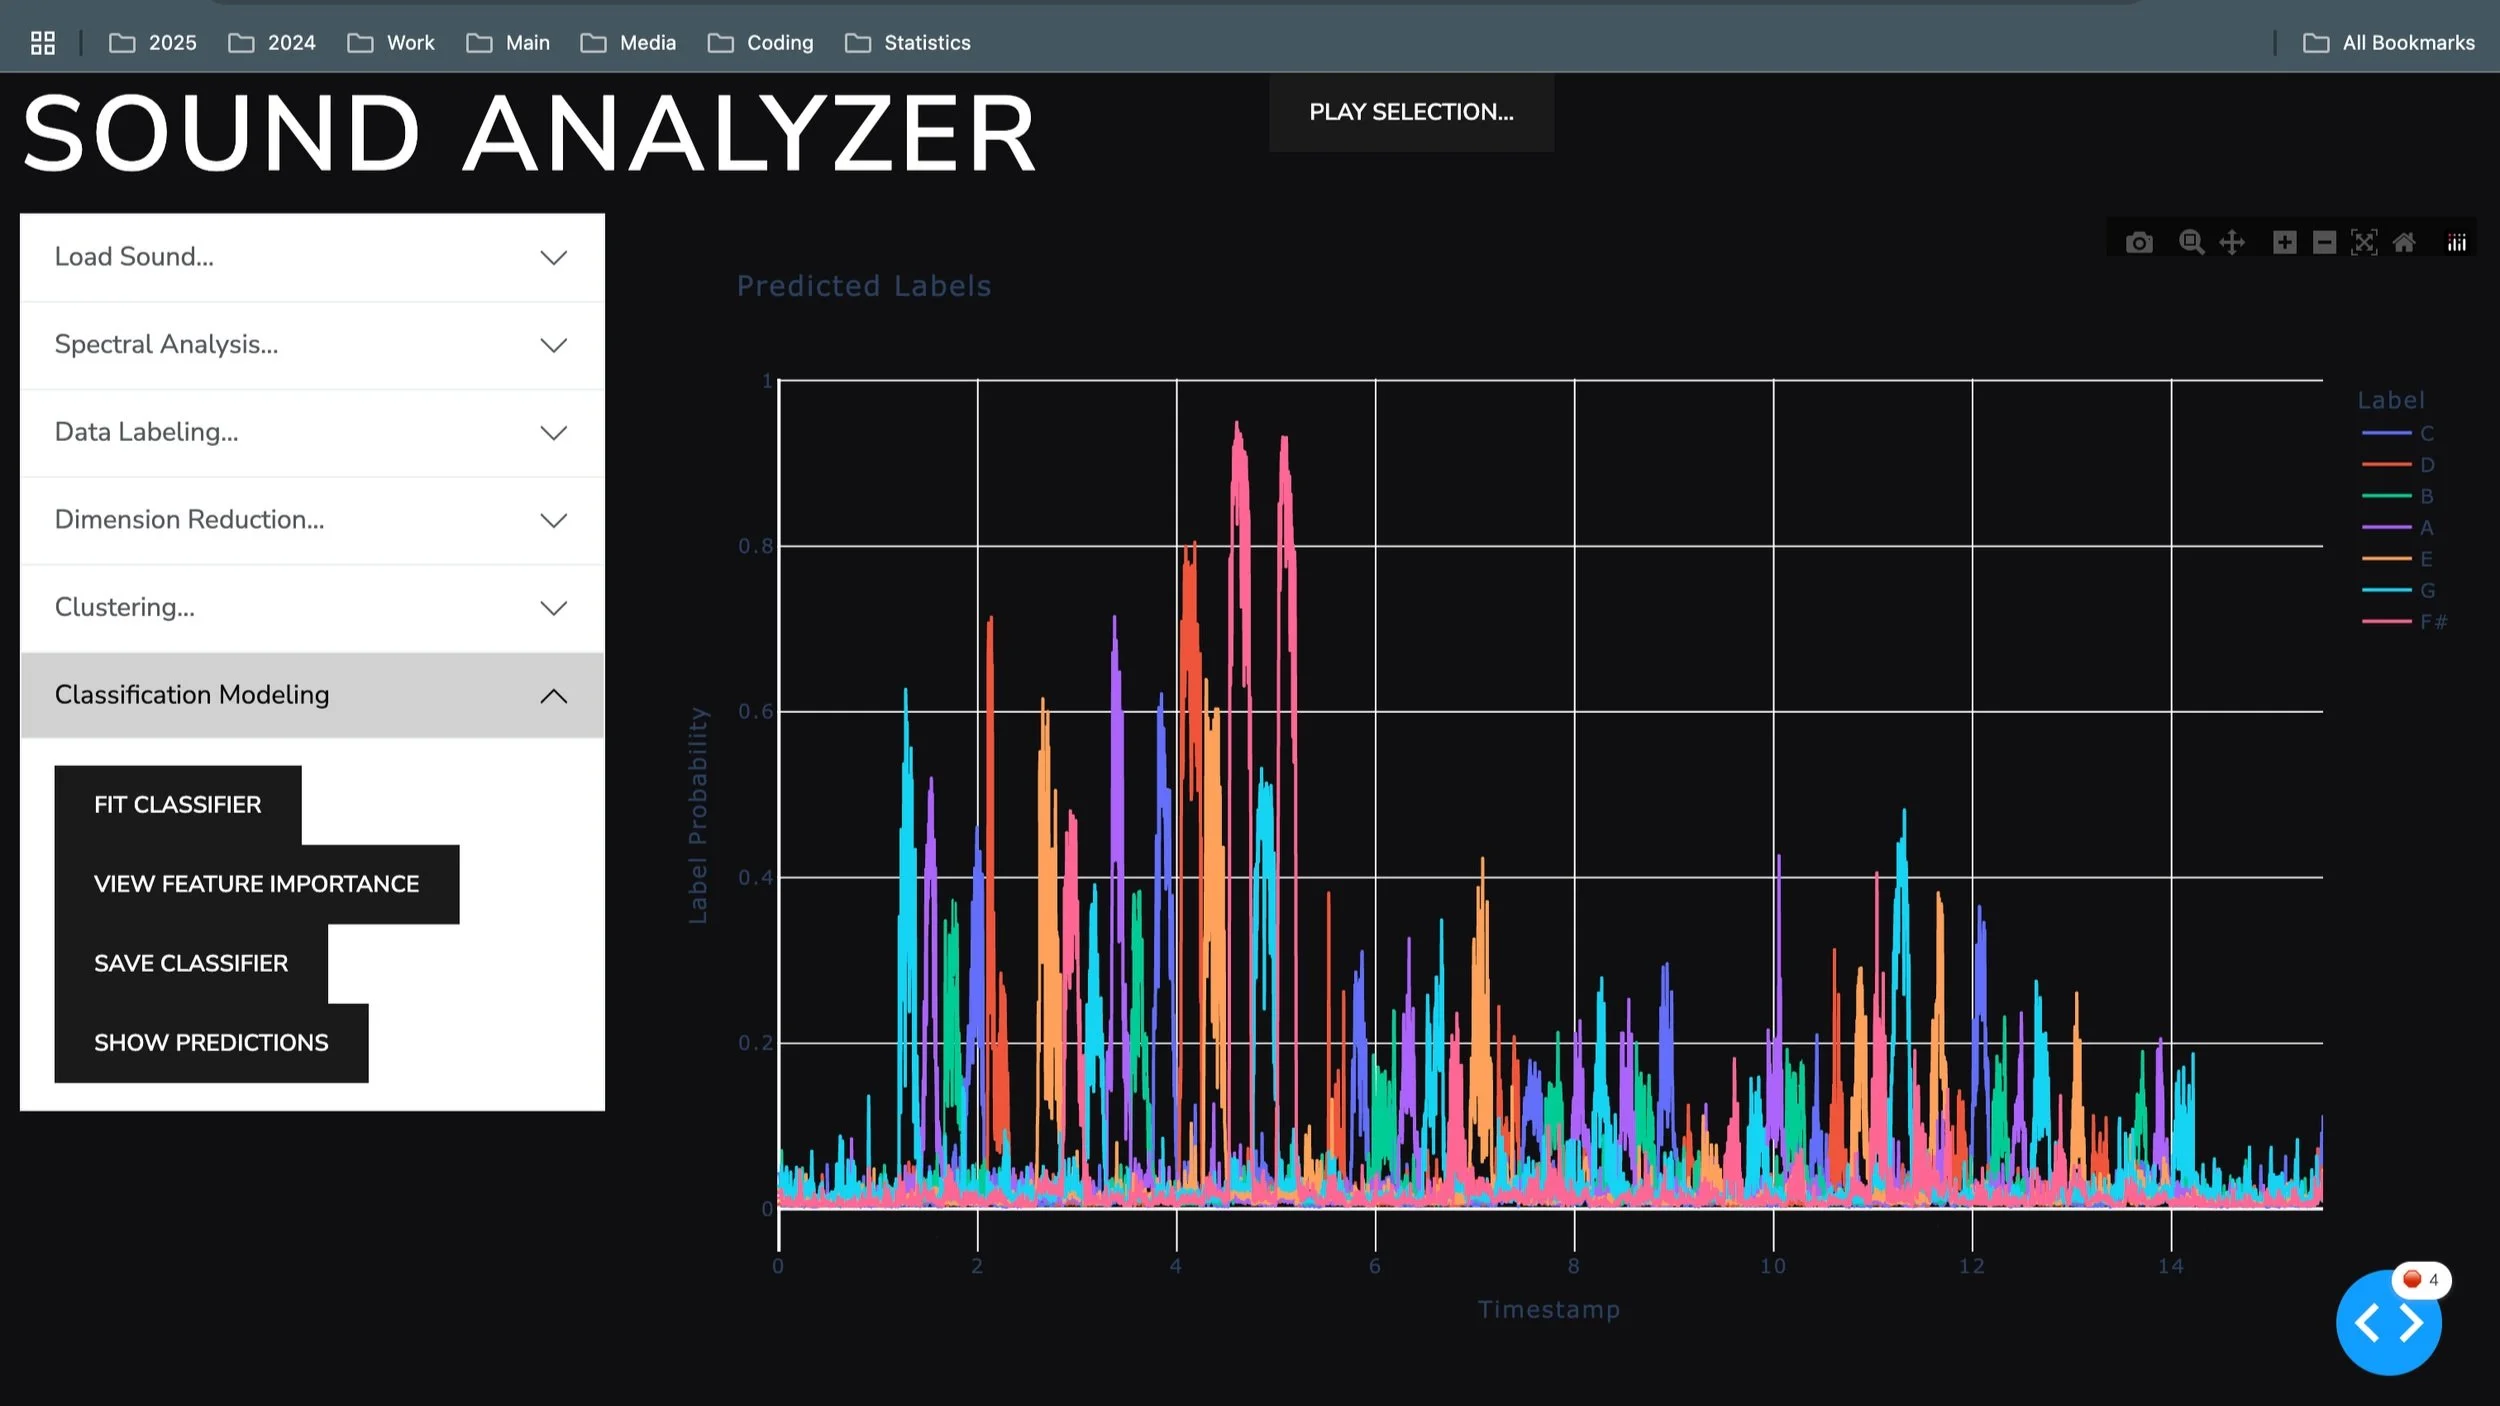
Note probability predicted by a random forest classifier trained to predict note label given spectrum principal components.
But, I wanted to detect notes and chords. Would individual note models be enough to detect chords? Would there be any advantage to building models for chords based on playing those chords? Or would composable models that detect individual notes be enough to name the chord being played? There are areas of research that I continue to work on using this sound analyzer application.
The code I created to perform this analysis and user interaction is on my github:

Data scientist takes guitar lessons
when a data scientist took guitar lessons, he decided to build a musical ai to help him master improvisation.
I decided to take lessons on guitar when I was 39. I had played guitar since age 13 and never took lessons. I found a teacher at a local music store, a jazz guitarist. These lessons gave me the opportunity to learn the fundamentals of music from a true master. I immediately saw every musical shortcoming I had all at once. Reading music was something I had rarely done before. I needed to practice a lot. He said the most important thing when learning a song is to learn the melody. And it is especially good to learn the words and practice to the original recording.

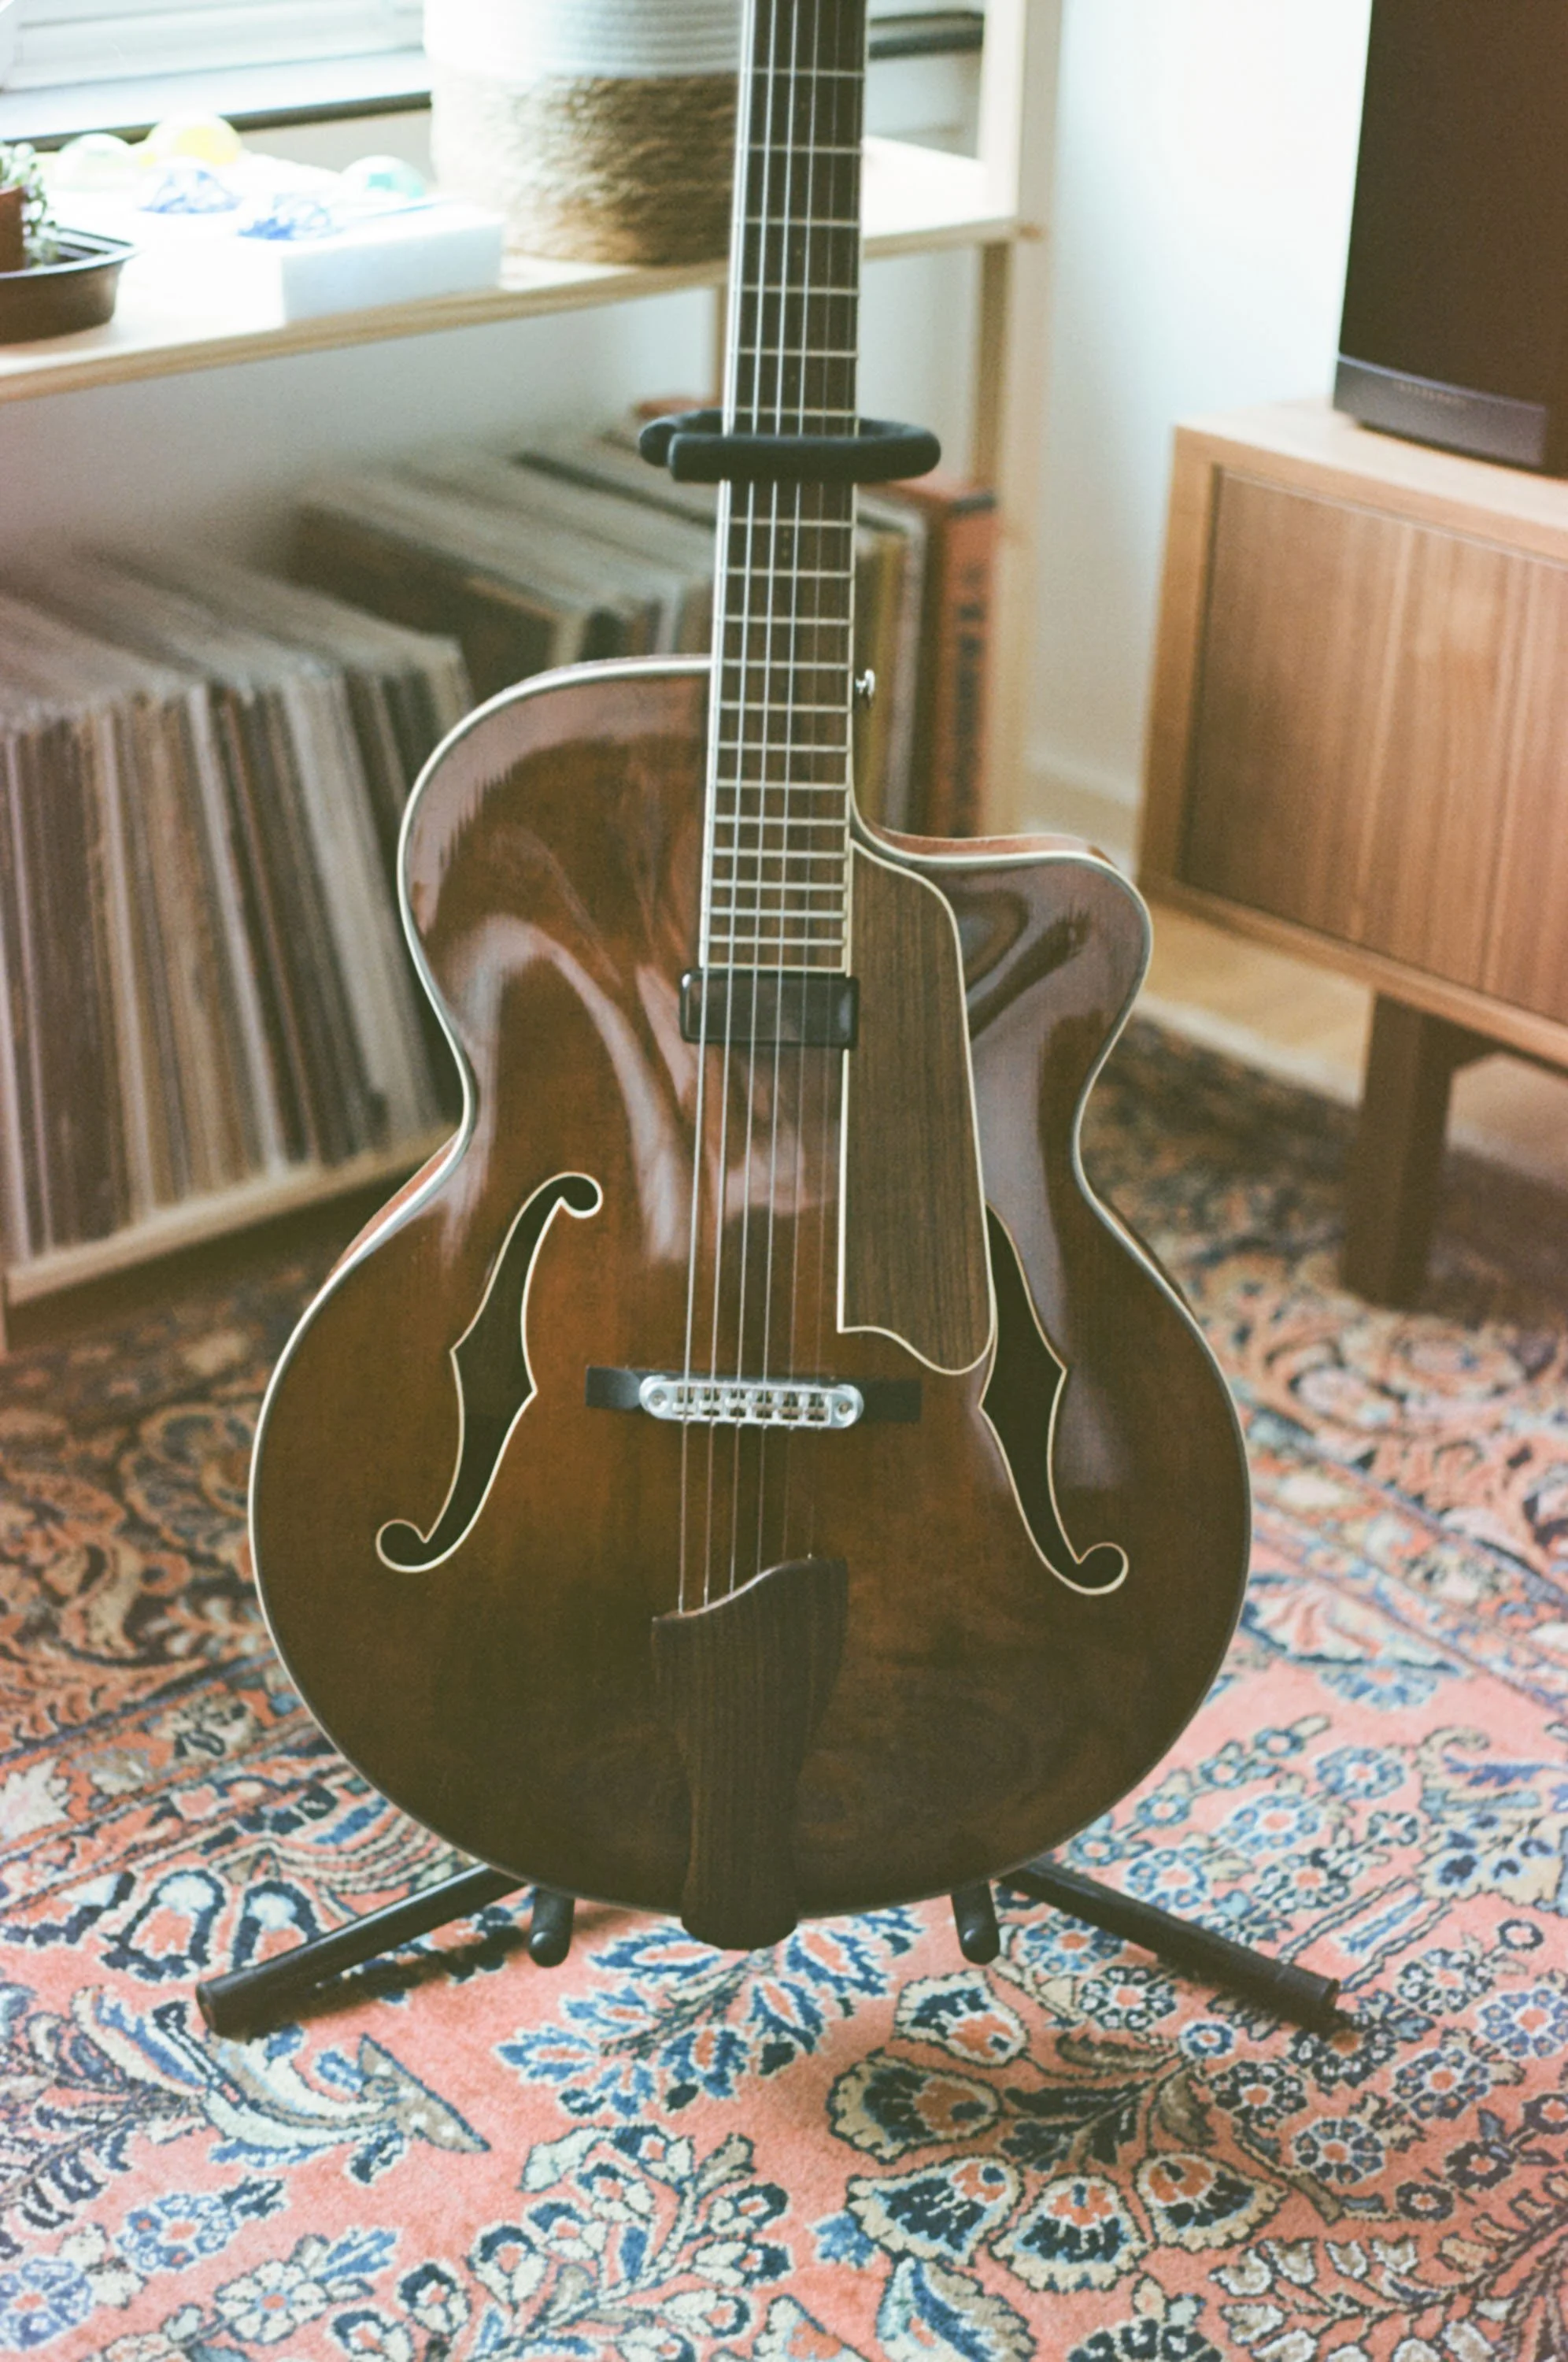
Eastman hollow body jazz guitar i am learning to play
An experienced musician can choose chords that harmonize with the melody, and not always the ones written. From chords, they can improvise a melody that leads its way through the changes. In order for me to do what he showed me, I needed to develop my playing ability, my perceptual skills, and and my creative skills. To truly master musical expression in the way he showed me, I need to be able to perceive the key of music, the melody, and chords, the chord functions. Currently, I can identify key and play it on the instrument. But my ability to recognize chords is limited. How could I grow my ability to identify which chords would harmonize with a melody? I need to practice.
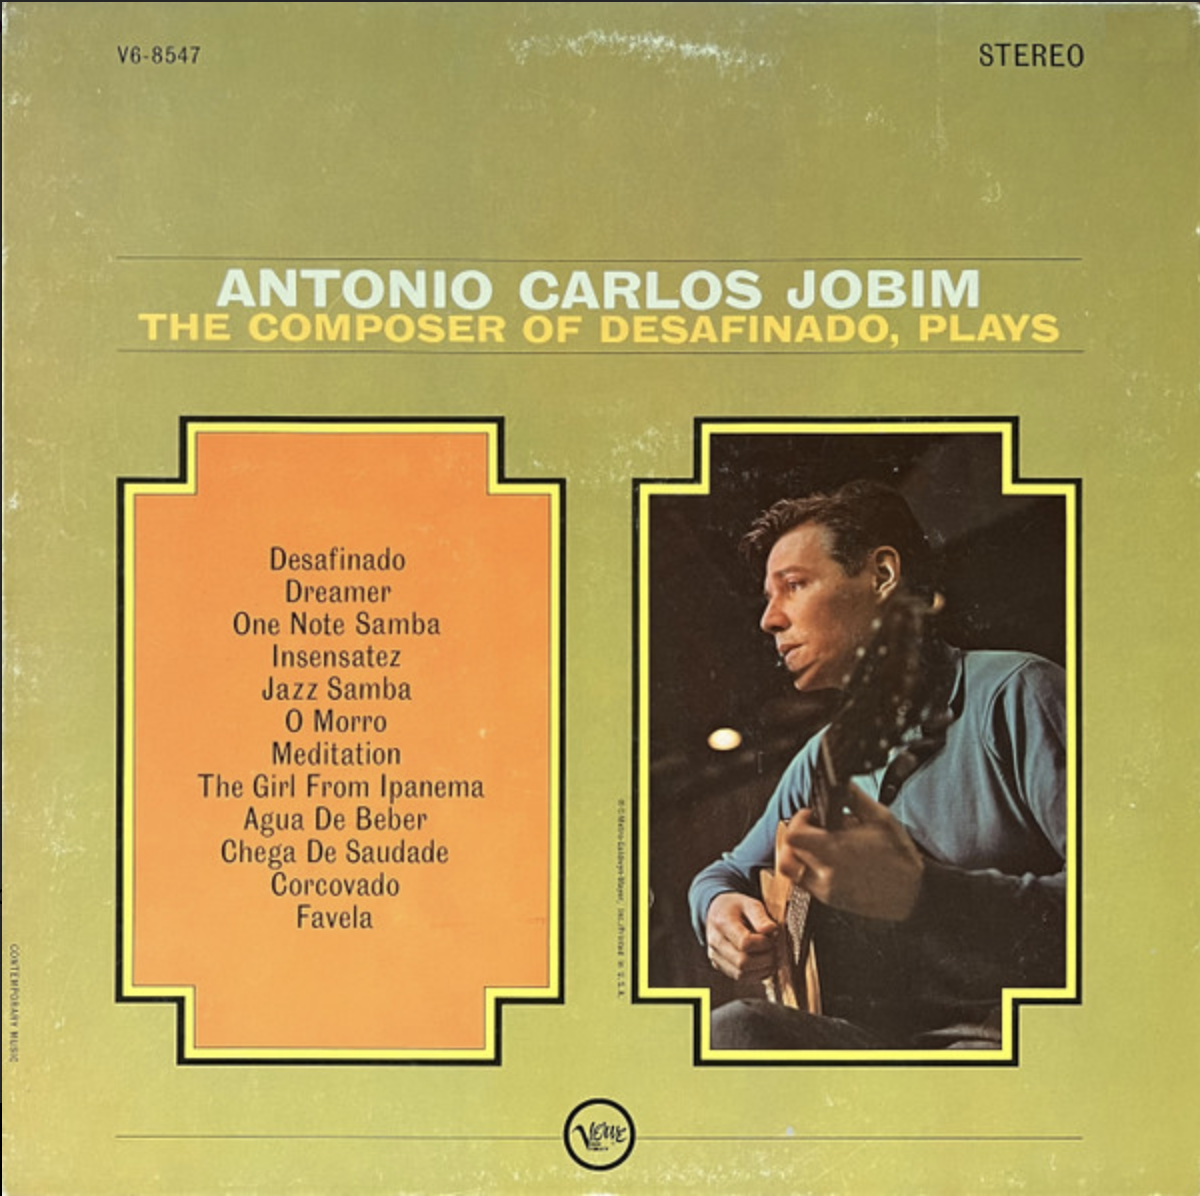
Cover art for the composer of Desafinado plays, by Antonio Carlos Jobim.
I could barely play a melody. So, I started learning the melodies of two songs I like. They were both Tom Jobim tunes. I always loved listening to Desafinado and Chega De Saudade among the jazz MP3’s stashed on a jazz band server at work in 2008. So I learned these bossa nova melodies as points to start trying to learn to improvise. After a few months I fully learned the melodies two these two songs, and chords various other bossa nova songs. And because I was learning new songs, I recorded many tracks of me practicing the melody and chords as written.
As I was practicing technique on guitar learning jazz standard melodies from the real book. Different sources would give different chords to play along to the melody. Why? I knew that there were different chords that were subsets of other chords. But, I found it difficult to recall all the chords related to a given chord. I didn’t have a good way of organizing related chords. Data scientist mode kicks in. With the help of a computer, I could just list all the notes I can play and then enumerate all possible chords and make my own naming system, couldn’t I? Then I could develop a measure of closeness based on shared notes and dissonances to recall related chords or chords that have similar function? This is just like me, to try to solve a problem through computation.
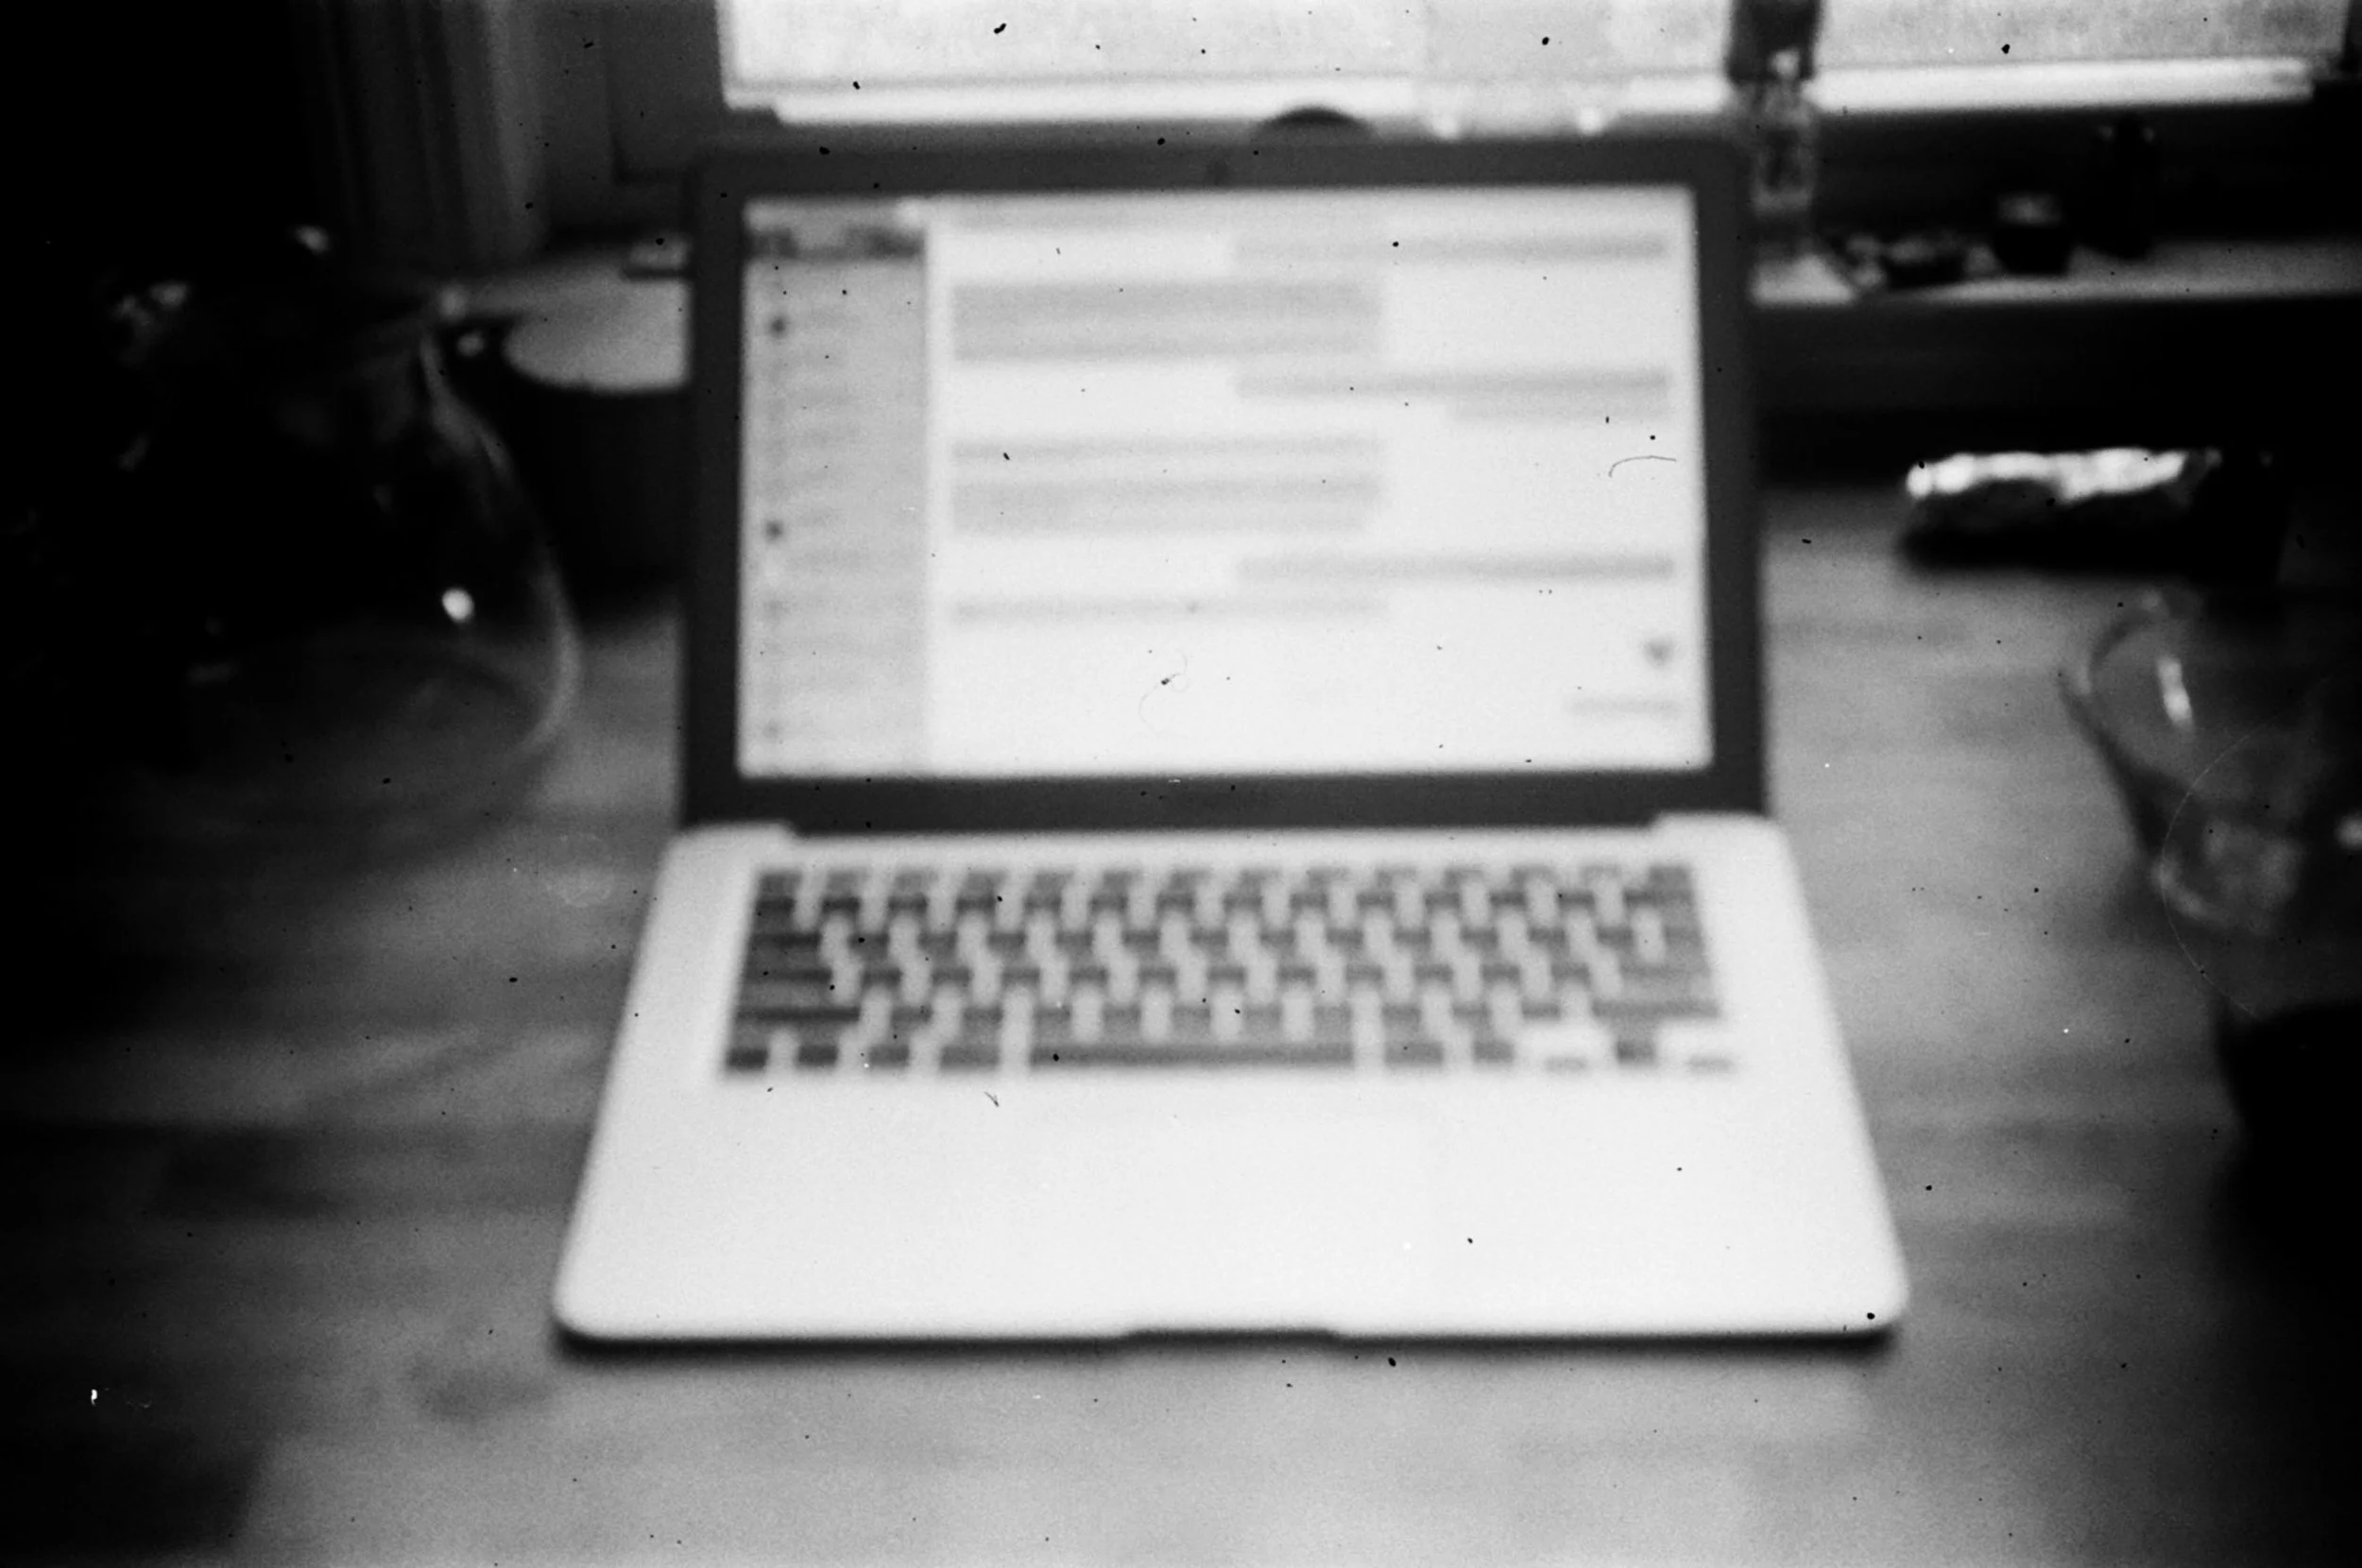
An old laptop. I always try to solve problems with computers.
But that got me thinking... Could I have the computer listen to a melody I’m playing and give me feedback? Could it give me suggestions on what chord changes would work with the melody? Could I make an algorithm detect chords and respond with an improvised melody? While I struggle to play Hanon exercises up and down the neck of my guitar, could I also create an artificially intelligent computer tool capable of understanding music I play and giving me suggestions to improve?
I looked for alternative tools to solve my problem. Various tools can transcribe melodies from recordings. Python sound library librosa can give you the note names in a melody by creating a chromagram. For individual notes, the problem is already solved by looking at the fundamental frequency of a sound. But would it work for multiple notes played at once (chords)? One tool I tried called Chordify gave a free trial. It detected and displayed the chords in Yellow by Coldplay. It seemed that someone had solved this problem of chord detection already. But I didn’t want to pay for it.
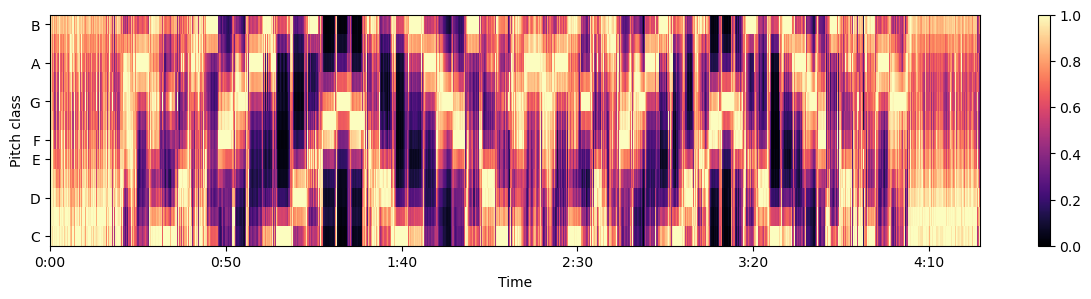
Chromagram of note intensities from Librosa library in Python. Data sources is a G major scale played through two octaves up and down twice.
I stubbornly started engineering a system to identify notes and chords that I could call my own. I started by creating algorithm that is trained on labeled sound data. It would predict notes, intervals, chords, based on labels that I would encode with my knowledge of music theory. So, I could choose to label the sound in many different ways. I could name individual notes. I could name whole chords. I could name intervals that are present. Each method of labeling has advantages and drawbacks. I would create the sounds I wanted to classify with my guitar and I would encode labels about features of the chords. What would predictive models for these labels look like? Would I be able to inspect the models to learn anything about what information is required to identify specific harmonic intervals from spectral data?

Eastman AR605CE guitar with tuneomatic bridge
I spent the summer recording bossa nova on my guitar. I practiced scales and other exercises and created a library of sound data that I started to label. In order to create a prediction algorithm that predicts the label of sound data, what should the input to such a model be? I believe that the information needed to infer label from sound is contained in its frequency spectrum. Why? When sound waves enter the ear, animal brains get stimulation that ultimately comes from nerves in the cochlea. The cochlea is a structure which has the ability to vibrate in response to sound stimulation. The shape of the cochlea combined with its mass and stiffness give it an array of distinct resonant frequencies. These frequencies would in theory be associated with different resonant mode shapes inside the cochlea. As with any resonant structure, the amplitude of vibration in each mode depends on the frequency content of the forcing function. So, I conclude that the information the our brain gets from our hearing apparatus must be contained in the frequency spectrum of the sound. So my algorithm should use some kind of frequency spectrogram as its predictor.
G major scale, Two octaves up and two steps down. Spectrogram and waveform overlayed.
I have created a github repo to store the code I am using to analyze the sound data and to create a UI for sound labeling in python Dash.
Github repo: https://github.com/ubiquitousidea/soundanalyzer