Musical Intervals and Lissajous curves
I set out to create a chord recognizer. At this point I have created a model that can predict a sound’s label by its spectrum. In order to create a chord recognizer from this, all I need is a language of chords for the labeling. How are chords labeled normally? What the heck does C major 7 mean?
What are Chords?
A chord is a set of notes played together, at the same time. Some notes sound good together. Other notes sound harsh together. And this harshness is related to the musical intervals present. Much of the chord name has to do with the intervals that are present in the chord. Chord names also contain the name of one note that the chord is anchored to. So chord names contain a reference to a specific note and references to other notes by way of intervals. The C major chord has the notes: C, E, and G. The name only makes reference to the note C. The modifier major refers to the presence of a note with a major third above C (E) and a perfect fifth above C (G). A chord with the same quality, major, can be constructed relative to any note.
What Intervals Sound Like
Interval refers to the distance between notes. The concept of an interval should be thought of as a proportion. How many of one wave fits into how many of another wave? So when we see the proportion 3:2, think of a space containing both 3 lobes of a wave and 2 lobes of a wave. The sound of an pitch interval 3:2 is called a perfect fifth in music theory prevalent here. The sound of a perfect fifth is the first two notes of Star Wars Theme.
What Intervals Look Like
One way to visualize the interval is with a time series graph. Here the lines represent sound pressure over time for two notes a perfect fifth apart.
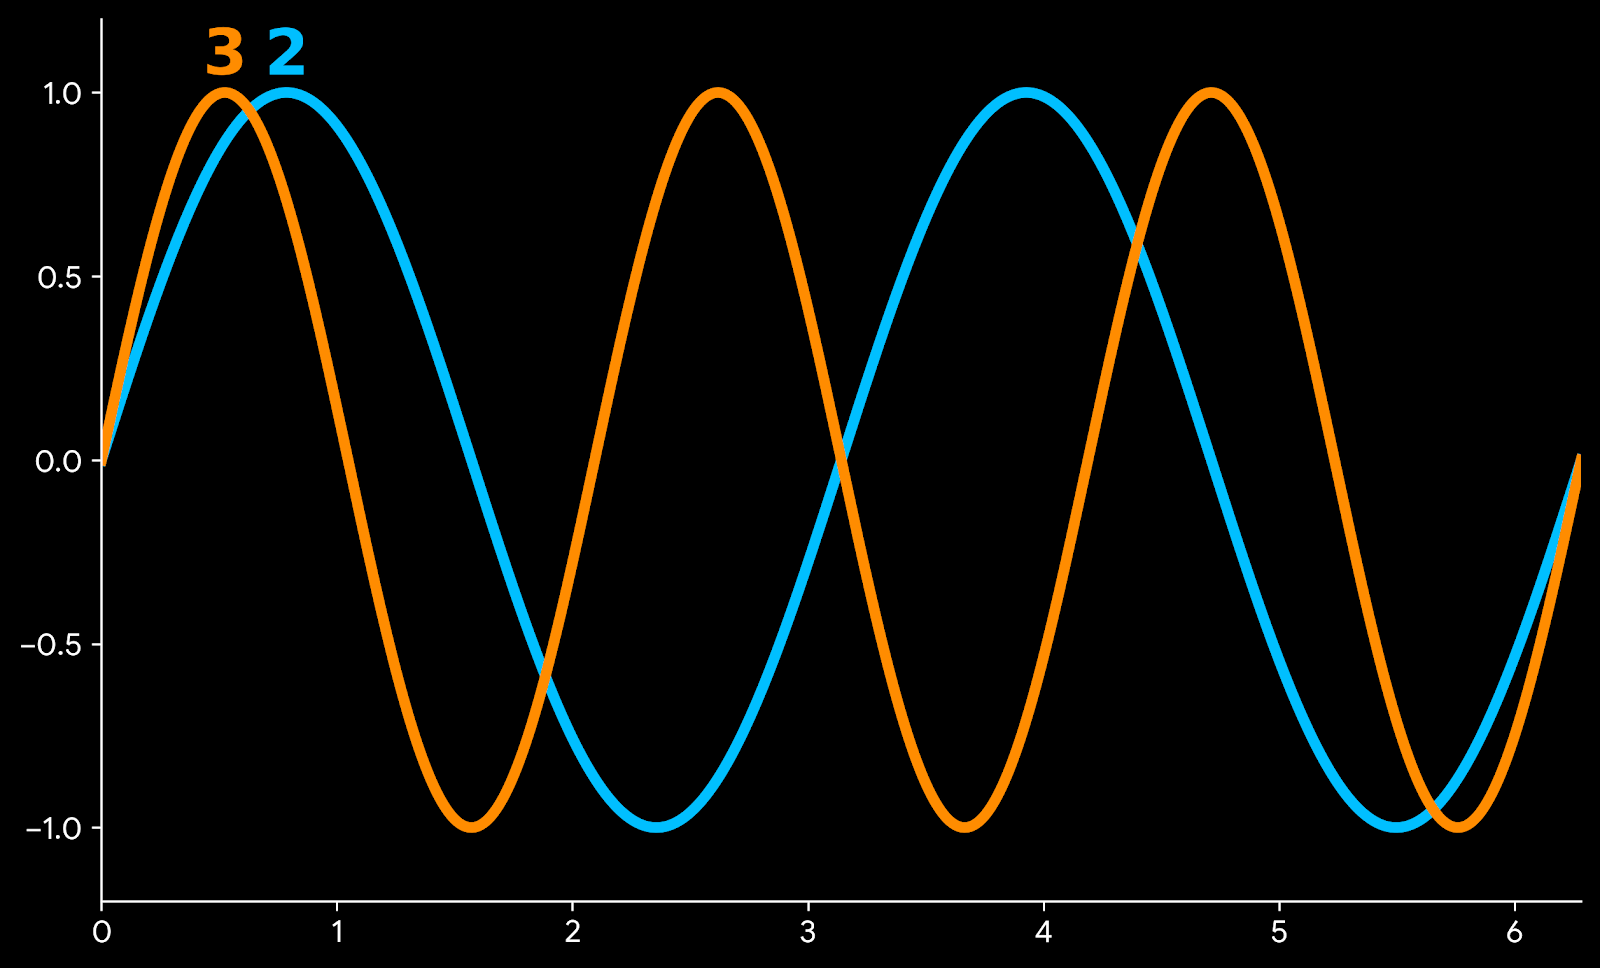
Perfect Fifth Interval (3:2)
This pair of curves shows how in the time it takes the blue wave to pulse twice, the orange wave pulses three times. This pattern is repeated exactly as time progresses. Another type of graph shows how the pressures vary together.
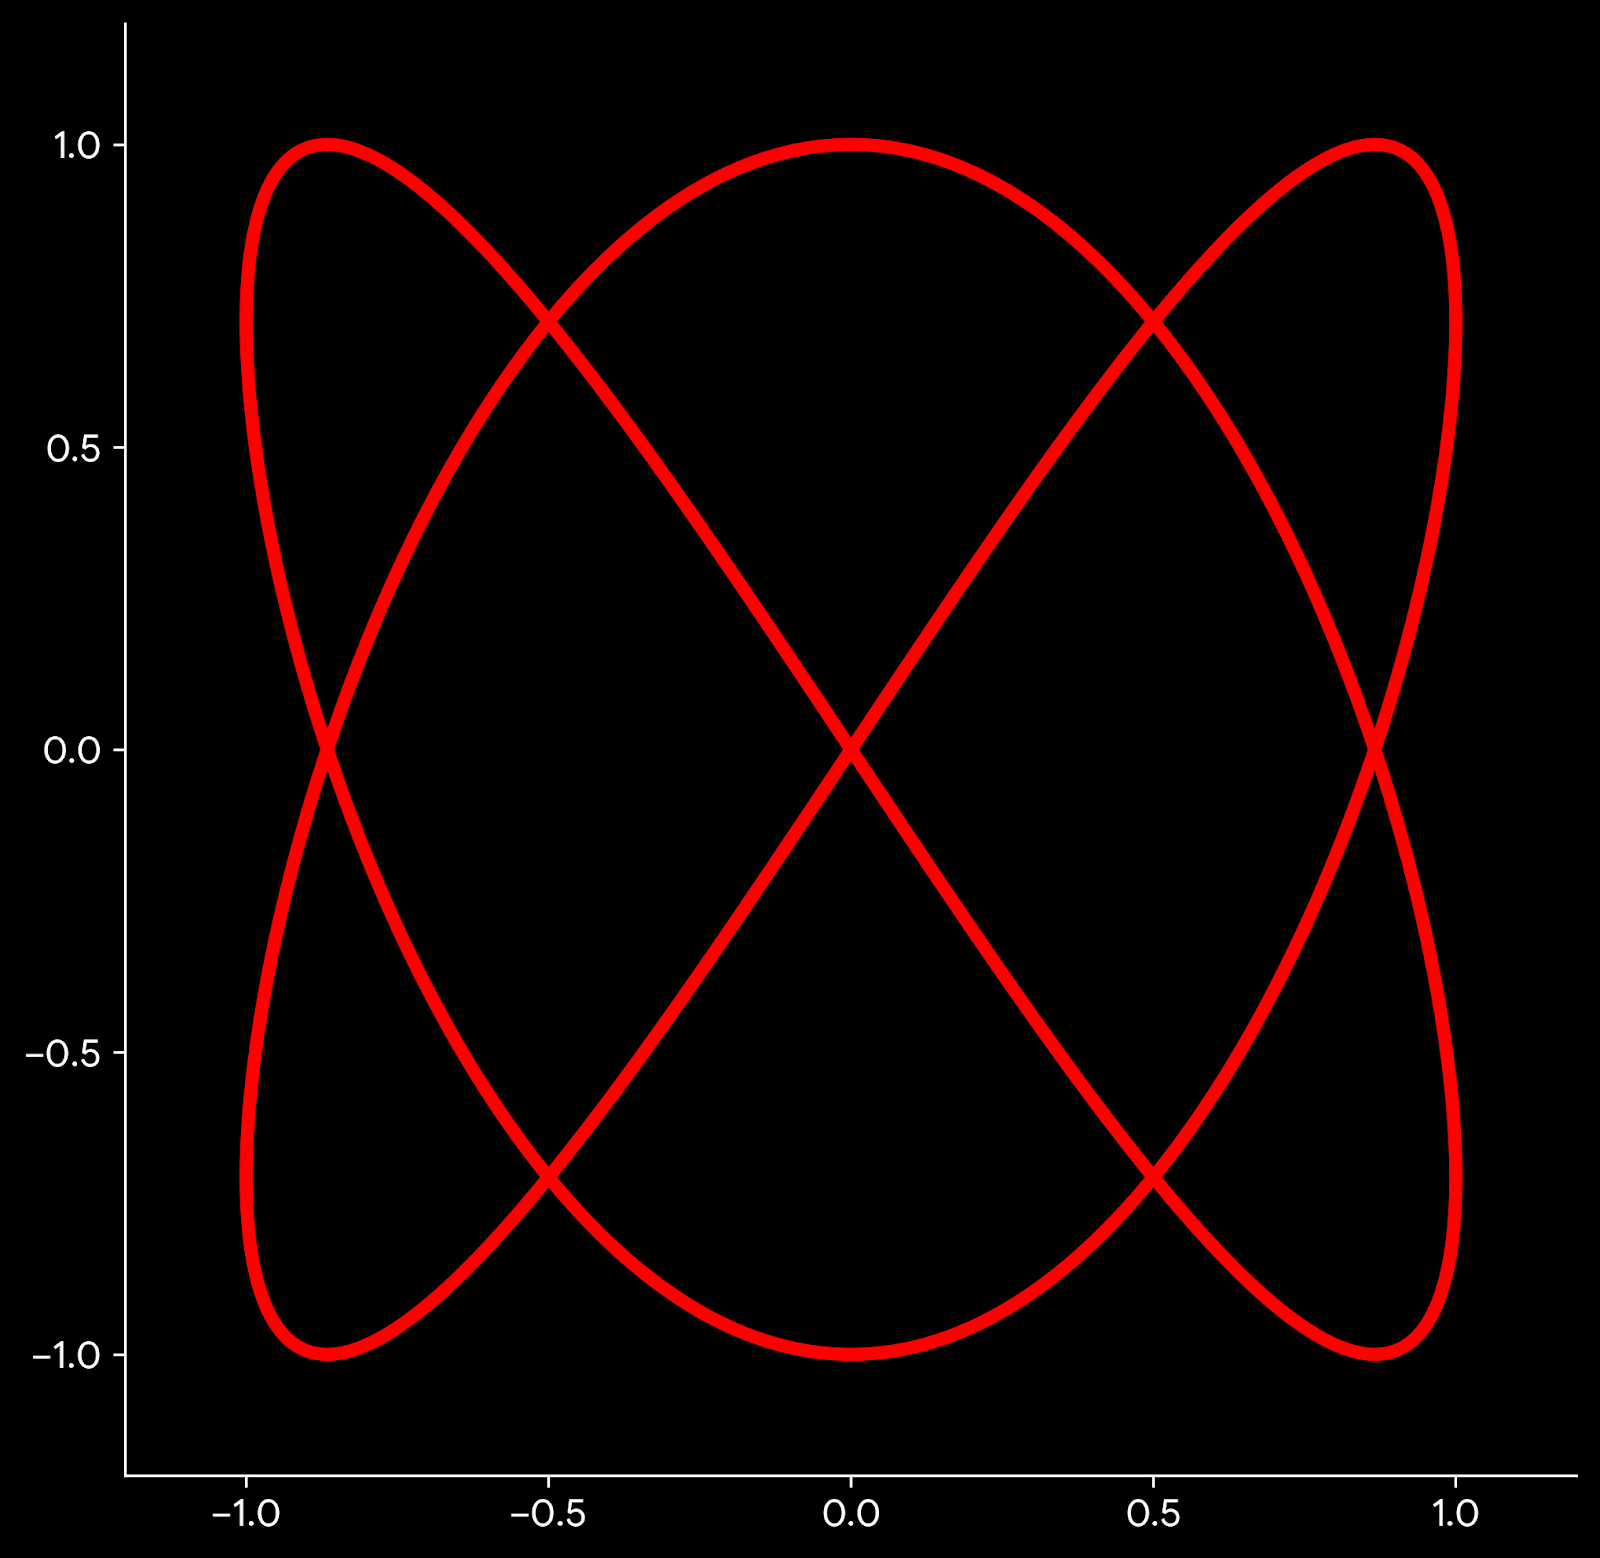
Lissajous curve for a Perfect Fifth
This graph is made using the same two waves. But here the line is created using the blue wave for X coordinate and the orange wave for the Y coordinate. This parametric curve is known as a Lissajous curve. The Lissajous curve depends on interval (frequency ratio), not on frequency itself. You can multiply frequencies by any constant and obtain the same Lissajous curve. The Lissajous curve is sensitive to phase. Try adding a phase angle to one of the component and see how the curve changes.
Questions
So what does a Lissajous curve tell you about a musical interval? And why does varying the phase angle appear to be the rotation of a 3D curve? Could the Lissajous curve be a tool for the recognition of intervals present in sound? How could this be applied to a single wave form resulting from the summation of waves of unknown frequencies and phase separations?